
| Name: CPLX2 | Sequence: fasta or formatted (134aa) | NCBI GI: 56550065 | |
|
Description: complexin 2
|
Referenced in:
| ||
Other entries for this name:
alt mRNA [134aa] complexin 2 | |||
|
Composition:
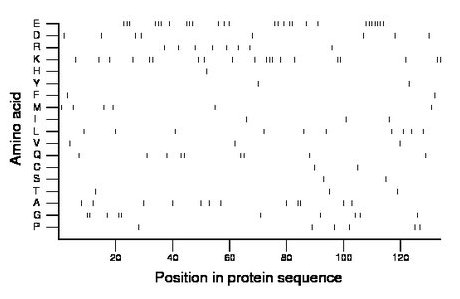
Amino acid Percentage Count Longest homopolymer A alanine 9.0 12 2 C cysteine 1.5 2 1 D aspartate 6.0 8 1 E glutamate 20.1 27 7 F phenylalanine 1.5 2 1 G glycine 7.5 10 2 H histidine 0.7 1 1 I isoleucine 2.2 3 1 K lysine 14.9 20 3 L leucine 7.5 10 1 M methionine 4.5 6 1 N asparagine 0.0 0 0 P proline 4.5 6 1 Q glutamine 6.7 9 2 R arginine 6.0 8 1 S serine 1.5 2 1 T threonine 2.2 3 1 V valine 2.2 3 1 W tryptophan 0.0 0 0 Y tyrosine 1.5 2 1 |
Comparative genomics:
Search single species RefSeq proteins at NCBI
Search summary 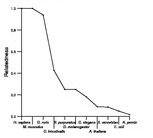
Figure data | ||
Related human proteins:Protein Relative score Description Self-match 1.000 complexin 2 CPLX2 1.000 complexin 2 CPLX1 0.832 complexin 1 CPLX3 0.152 complexin 3 RGAG4 0.123 retrotransposon gag domain containing 4 USP35 0.119 ubiquitin specific protease 35 WDR87 0.102 NYD-SP11 protein LOC100133599 0.098 PREDICTED: hypothetical protein LOC283685 0.098 PREDICTED: golgi autoantigen, golgin subfamily a-li... TCHH 0.090 trichohyalin MAP7D2 0.090 MAP7 domain containing 2 CPLX4 0.090 complexin 4 RBM25 0.082 RNA binding motif protein 25 LOC440243 0.082 PREDICTED: Putative golgin subfamily A member 6-lik... RPGR 0.078 retinitis pigmentosa GTPase regulator isoform C [Hom... NEFM 0.078 neurofilament, medium polypeptide 150kDa isoform 1 ... NEFM 0.078 neurofilament, medium polypeptide 150kDa isoform 2 ... LOC100294088 0.078 PREDICTED: hypothetical protein, partial LOC727832 0.074 golgi autoantigen, golgin subfamily a-like BAT2D1 0.074 HBxAg transactivated protein 2 LOC283767 0.070 golgi autoantigen, golgin subfamily a-like DNMT1 0.070 DNA (cytosine-5-)-methyltransferase 1 isoform a [Ho... DNMT1 0.070 DNA (cytosine-5-)-methyltransferase 1 isoform b [Homo... KIAA1211 0.070 hypothetical protein LOC57482 PELP1 0.070 proline, glutamic acid and leucine rich protein 1 [... DBN1 0.070 drebrin 1 isoform b DBN1 0.070 drebrin 1 isoform a LOC100133599 0.070 PREDICTED: hypothetical protein LRRC59 0.070 leucine rich repeat containing 59 USP8 0.070 ubiquitin specific peptidase 8Human BLASTP results (used to prepare the table) | |||
Gene descriptions are from NCBI RefSeq. Search results were obtained with NCBI BLAST and RefSeq entries. When identical proteins are present, the self-match may not be listed first in BLASTP output. In such cases, the table above has been reordered to place it first.
See About the Figures for the scoring system used in the figure above right. The same scoring system was used in the table of BLASTP results.
Guide to the Human Genome
Copyright © 2010 by Stewart Scherer. All rights reserved.
