
| Name: GPR3 | Sequence: fasta or formatted (330aa) | NCBI GI: 4885325 | |
|
Description: G protein-coupled receptor 3
|
Referenced in:
| ||
|
Composition:
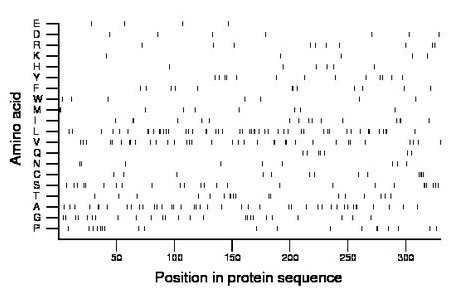
Amino acid Percentage Count Longest homopolymer A alanine 12.4 41 2 C cysteine 3.9 13 4 D aspartate 2.1 7 1 E glutamate 1.2 4 1 F phenylalanine 3.6 12 2 G glycine 7.6 25 2 H histidine 1.8 6 1 I isoleucine 4.8 16 2 K lysine 1.5 5 1 L leucine 14.8 49 2 M methionine 2.7 9 2 N asparagine 2.7 9 1 P proline 5.8 19 2 Q glutamine 2.1 7 2 R arginine 3.0 10 1 S serine 7.6 25 3 T threonine 5.5 18 2 V valine 10.6 35 2 W tryptophan 2.1 7 1 Y tyrosine 3.9 13 2 |
Comparative genomics:
Search single species RefSeq proteins at NCBI
Search summary 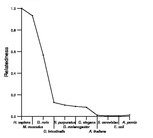
Figure data | ||
Related human proteins:Protein Relative score Description Self-match 1.000 G protein-coupled receptor 3 GPR6 0.571 G protein-coupled receptor 6 GPR12 0.563 G protein-coupled receptor 12 LPAR2 0.171 lysophosphatidic acid receptor 2 S1PR5 0.167 endothelial differentiation, sphingolipid G-protein-... LPAR3 0.166 lysophosphatidic acid receptor 3 S1PR2 0.160 endothelial differentiation, sphingolipid G-protein... S1PR1 0.158 sphingosine-1-phosphate receptor 1 LPAR1 0.152 lysophosphatidic acid receptor 1 LPAR1 0.152 lysophosphatidic acid receptor 1 MC4R 0.141 melanocortin 4 receptor MC5R 0.138 melanocortin 5 receptor MC3R 0.136 melanocortin 3 receptor ADORA2B 0.136 adenosine A2b receptor S1PR4 0.130 sphingosine-1-phosphate receptor 4 precursor CNR1 0.130 cannabinoid receptor 1 isoform a CNR1 0.130 cannabinoid receptor 1 isoform a CNR1 0.130 cannabinoid receptor 1 isoform a CNR1 0.130 cannabinoid receptor 1 isoform a CNR1 0.130 cannabinoid receptor 1 isoform a CNR1 0.130 cannabinoid receptor 1 isoform b S1PR3 0.128 sphingosine-1-phosphate receptor 3 CNR2 0.121 cannabinoid receptor 2 (macrophage) MC2R 0.116 melanocortin 2 receptor ADORA3 0.114 adenosine A3 receptor isoform 2 MC1R 0.113 melanocortin 1 receptor ADORA2A 0.106 adenosine A2a receptor ADORA1 0.099 adenosine A1 receptor ADORA1 0.099 adenosine A1 receptor HRH2 0.095 histamine receptor H2 isoform 1Human BLASTP results (used to prepare the table) | |||
Gene descriptions are from NCBI RefSeq. Search results were obtained with NCBI BLAST and RefSeq entries. When identical proteins are present, the self-match may not be listed first in BLASTP output. In such cases, the table above has been reordered to place it first.
See About the Figures for the scoring system used in the figure above right. The same scoring system was used in the table of BLASTP results.
Guide to the Human Genome
Copyright © 2010 by Stewart Scherer. All rights reserved.
