
| Name: LPAR1 | Sequence: fasta or formatted (364aa) | NCBI GI: 16950636 | |
|
Description: lysophosphatidic acid receptor 1
|
Referenced in: G-Protein-coupled Receptors
| ||
Other entries for this name:
alt mRNA [364aa] lysophosphatidic acid receptor 1 | |||
|
Composition:
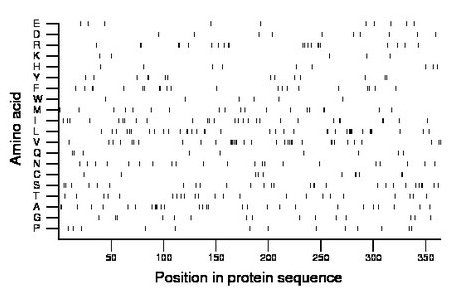
Amino acid Percentage Count Longest homopolymer A alanine 8.0 29 3 C cysteine 3.0 11 2 D aspartate 2.7 10 1 E glutamate 2.7 10 1 F phenylalanine 5.8 21 2 G glycine 4.1 15 1 H histidine 2.5 9 1 I isoleucine 7.7 28 2 K lysine 1.4 5 1 L leucine 10.2 37 4 M methionine 5.2 19 2 N asparagine 5.8 21 1 P proline 3.6 13 1 Q glutamine 2.5 9 1 R arginine 6.0 22 2 S serine 7.7 28 2 T threonine 6.3 23 1 V valine 9.3 34 4 W tryptophan 1.6 6 1 Y tyrosine 3.8 14 2 |
Comparative genomics:
Search single species RefSeq proteins at NCBI
Search summary 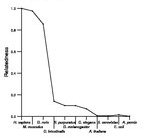
Figure data | ||
Related human proteins:Protein Relative score Description Self-match 1.000 lysophosphatidic acid receptor 1 LPAR1 1.000 lysophosphatidic acid receptor 1 LPAR2 0.489 lysophosphatidic acid receptor 2 LPAR3 0.484 lysophosphatidic acid receptor 3 S1PR1 0.305 sphingosine-1-phosphate receptor 1 S1PR3 0.281 sphingosine-1-phosphate receptor 3 S1PR2 0.244 endothelial differentiation, sphingolipid G-protein... S1PR5 0.240 endothelial differentiation, sphingolipid G-protein-... S1PR4 0.203 sphingosine-1-phosphate receptor 4 precursor CNR1 0.153 cannabinoid receptor 1 isoform a CNR1 0.153 cannabinoid receptor 1 isoform a CNR1 0.153 cannabinoid receptor 1 isoform a CNR1 0.153 cannabinoid receptor 1 isoform a CNR1 0.153 cannabinoid receptor 1 isoform a CNR1 0.153 cannabinoid receptor 1 isoform b MC4R 0.147 melanocortin 4 receptor MC5R 0.147 melanocortin 5 receptor MC3R 0.137 melanocortin 3 receptor GPR3 0.137 G protein-coupled receptor 3 GPR12 0.134 G protein-coupled receptor 12 ADORA1 0.114 adenosine A1 receptor ADORA1 0.114 adenosine A1 receptor GPR6 0.114 G protein-coupled receptor 6 MC2R 0.114 melanocortin 2 receptor ADORA2A 0.112 adenosine A2a receptor CNR2 0.110 cannabinoid receptor 2 (macrophage) ADRA1B 0.092 alpha-1B-adrenergic receptor MC1R 0.090 melanocortin 1 receptor ADORA2B 0.090 adenosine A2b receptor ADRB2 0.079 adrenergic, beta-2-, receptor, surfaceHuman BLASTP results (used to prepare the table) | |||
Gene descriptions are from NCBI RefSeq. Search results were obtained with NCBI BLAST and RefSeq entries. When identical proteins are present, the self-match may not be listed first in BLASTP output. In such cases, the table above has been reordered to place it first.
See About the Figures for the scoring system used in the figure above right. The same scoring system was used in the table of BLASTP results.
Guide to the Human Genome
Copyright © 2010 by Stewart Scherer. All rights reserved.
