
| Name: S1PR5 | Sequence: fasta or formatted (398aa) | NCBI GI: 13540517 | |
|
Description: endothelial differentiation, sphingolipid G-protein-coupled receptor, 8
|
Referenced in:
| ||
|
Composition:
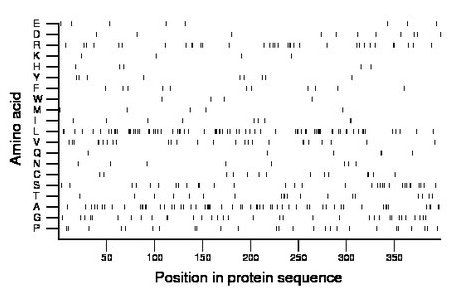
Amino acid Percentage Count Longest homopolymer A alanine 14.8 59 4 C cysteine 3.5 14 2 D aspartate 2.8 11 1 E glutamate 2.0 8 1 F phenylalanine 2.8 11 1 G glycine 8.5 34 2 H histidine 1.3 5 1 I isoleucine 2.3 9 2 K lysine 1.0 4 1 L leucine 18.6 74 5 M methionine 1.3 5 1 N asparagine 2.0 8 1 P proline 6.5 26 2 Q glutamine 1.5 6 2 R arginine 8.5 34 2 S serine 8.0 32 2 T threonine 4.8 19 2 V valine 6.5 26 2 W tryptophan 1.0 4 1 Y tyrosine 2.3 9 1 |
Comparative genomics:
Search single species RefSeq proteins at NCBI
Search summary 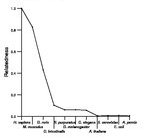
Figure data | ||
Related human proteins:Protein Relative score Description Self-match 1.000 endothelial differentiation, sphingolipid G-protein-... S1PR1 0.392 sphingosine-1-phosphate receptor 1 S1PR3 0.358 sphingosine-1-phosphate receptor 3 S1PR2 0.337 endothelial differentiation, sphingolipid G-protein... S1PR4 0.291 sphingosine-1-phosphate receptor 4 precursor LPAR1 0.225 lysophosphatidic acid receptor 1 LPAR1 0.225 lysophosphatidic acid receptor 1 LPAR2 0.217 lysophosphatidic acid receptor 2 LPAR3 0.197 lysophosphatidic acid receptor 3 GPR3 0.141 G protein-coupled receptor 3 GPR12 0.140 G protein-coupled receptor 12 GPR6 0.120 G protein-coupled receptor 6 CNR1 0.120 cannabinoid receptor 1 isoform a CNR1 0.120 cannabinoid receptor 1 isoform a CNR1 0.120 cannabinoid receptor 1 isoform a CNR1 0.120 cannabinoid receptor 1 isoform a CNR1 0.120 cannabinoid receptor 1 isoform a CNR1 0.120 cannabinoid receptor 1 isoform b CNR2 0.110 cannabinoid receptor 2 (macrophage) MC5R 0.099 melanocortin 5 receptor MC4R 0.096 melanocortin 4 receptor MC3R 0.094 melanocortin 3 receptor HTR6 0.079 5-hydroxytryptamine (serotonin) receptor 6 ADRA1B 0.073 alpha-1B-adrenergic receptor MC2R 0.071 melanocortin 2 receptor MC1R 0.070 melanocortin 1 receptor ADRB1 0.069 beta-1-adrenergic receptor ADORA2A 0.069 adenosine A2a receptor SSTR5 0.062 somatostatin receptor 5 ADRA1A 0.062 alpha-1A-adrenergic receptor isoform 4Human BLASTP results (used to prepare the table) | |||
Gene descriptions are from NCBI RefSeq. Search results were obtained with NCBI BLAST and RefSeq entries. When identical proteins are present, the self-match may not be listed first in BLASTP output. In such cases, the table above has been reordered to place it first.
See About the Figures for the scoring system used in the figure above right. The same scoring system was used in the table of BLASTP results.
Guide to the Human Genome
Copyright © 2010 by Stewart Scherer. All rights reserved.
