
| Name: ADORA1 | Sequence: fasta or formatted (326aa) | NCBI GI: 4501947 | |
|
Description: adenosine A1 receptor
|
Referenced in: Nucleotide and Nucleoside Receptors
| ||
Other entries for this name:
alt mRNA [326aa] adenosine A1 receptor | |||
|
Composition:
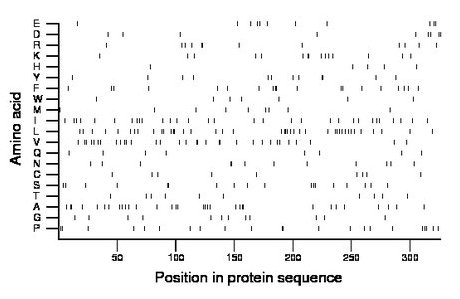
Amino acid Percentage Count Longest homopolymer A alanine 9.8 32 2 C cysteine 2.8 9 1 D aspartate 2.8 9 2 E glutamate 3.4 11 2 F phenylalanine 5.8 19 2 G glycine 3.7 12 1 H histidine 1.5 5 1 I isoleucine 9.5 31 1 K lysine 4.6 15 2 L leucine 12.6 41 3 M methionine 2.8 9 1 N asparagine 3.7 12 2 P proline 6.7 22 2 Q glutamine 2.5 8 1 R arginine 3.7 12 2 S serine 5.5 18 2 T threonine 3.1 10 1 V valine 9.8 32 2 W tryptophan 2.1 7 1 Y tyrosine 3.7 12 2 |
Comparative genomics:
Search single species RefSeq proteins at NCBI
Search summary 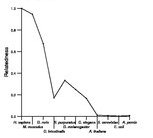
Figure data | ||
Related human proteins:Protein Relative score Description Self-match 1.000 adenosine A1 receptor ADORA1 1.000 adenosine A1 receptor ADORA3 0.438 adenosine A3 receptor isoform 2 ADORA2A 0.438 adenosine A2a receptor ADORA2B 0.389 adenosine A2b receptor ADORA3 0.156 adenosine A3 receptor isoform 1 HRH2 0.154 histamine receptor H2 isoform 1 HRH2 0.154 histamine receptor H2 isoform 2 HTR4 0.143 serotonin 5-HT4 receptor isoform hb DRD1 0.143 dopamine receptor D1 HTR4 0.141 serotonin 5-HT4 receptor isoform n HTR4 0.141 serotonin 5-HT4 receptor isoform i HTR4 0.141 serotonin 5-HT4 receptor isoform d HTR4 0.141 serotonin 5-HT4 receptor isoform a HTR4 0.141 serotonin 5-HT4 receptor isoform g HTR4 0.141 serotonin 5-HT4 receptor isoform b ADRA1A 0.138 alpha-1A-adrenergic receptor isoform 4 ADRA1A 0.138 alpha-1A-adrenergic receptor isoform 1 ADRA1A 0.138 alpha-1A-adrenergic receptor isoform 2 ADRA1A 0.138 alpha-1A-adrenergic receptor isoform 3 ADRA1B 0.133 alpha-1B-adrenergic receptor ADRA1D 0.132 alpha-1D-adrenergic receptor HTR2C 0.130 5-hydroxytryptamine (serotonin) receptor 2C LPAR1 0.129 lysophosphatidic acid receptor 1 LPAR1 0.129 lysophosphatidic acid receptor 1 DRD5 0.125 dopamine receptor D5 ADRB2 0.122 adrenergic, beta-2-, receptor, surface HCRTR1 0.122 orexin receptor 1 HTR6 0.119 5-hydroxytryptamine (serotonin) receptor 6 MC5R 0.117 melanocortin 5 receptorHuman BLASTP results (used to prepare the table) | |||
Gene descriptions are from NCBI RefSeq. Search results were obtained with NCBI BLAST and RefSeq entries. When identical proteins are present, the self-match may not be listed first in BLASTP output. In such cases, the table above has been reordered to place it first.
See About the Figures for the scoring system used in the figure above right. The same scoring system was used in the table of BLASTP results.
Guide to the Human Genome
Copyright © 2010 by Stewart Scherer. All rights reserved.
