
| Name: TFAM | Sequence: fasta or formatted (246aa) | NCBI GI: 4507401 | |
|
Description: transcription factor A, mitochondrial
|
Referenced in:
| ||
|
Composition:
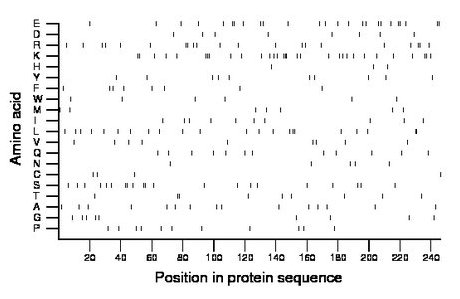
Amino acid Percentage Count Longest homopolymer A alanine 6.1 15 1 C cysteine 1.6 4 1 D aspartate 3.3 8 1 E glutamate 10.2 25 2 F phenylalanine 3.3 8 1 G glycine 3.7 9 1 H histidine 1.2 3 1 I isoleucine 4.1 10 1 K lysine 12.6 31 3 L leucine 8.9 22 2 M methionine 2.8 7 1 N asparagine 2.0 5 1 P proline 4.5 11 1 Q glutamine 4.9 12 1 R arginine 8.5 21 2 S serine 8.5 21 2 T threonine 3.7 9 2 V valine 3.7 9 1 W tryptophan 2.4 6 1 Y tyrosine 4.1 10 1 |
Comparative genomics:
Search single species RefSeq proteins at NCBI
Search summary 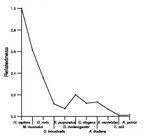
Figure data | ||
Related human proteins:Protein Relative score Description Self-match 1.000 transcription factor A, mitochondrial UBTFL1 0.110 upstream binding transcription factor, RNA polymera... UBTFL3 0.099 PREDICTED: upstream binding transcription factor, R... UBTFL5 0.099 PREDICTED: upstream binding transcription factor, R... UBTF 0.093 upstream binding transcription factor, RNA polymera... UBTF 0.093 upstream binding transcription factor, RNA polymera... UBTF 0.093 upstream binding transcription factor, RNA polymerase... UBTFL6 0.086 PREDICTED: upstream binding transcription factor, R... UBTFL6 0.084 PREDICTED: upstream binding transcription factor, R... UBTFL6 0.084 PREDICTED: upstream binding transcription factor, R... HMGB1 0.068 high-mobility group box 1 HMGB3 0.061 high-mobility group box 3 LOC441795 0.059 PREDICTED: high mobility group protein B3-like prot... LOC441795 0.059 PREDICTED: high mobility group protein B3-like prot... HMGB4 0.059 HMG2 like isoform 1 SMARCE1 0.057 SWI/SNF-related matrix-associated actin-dependent re... HMG20B 0.055 high-mobility group 20B HMGB1L1 0.053 high-mobility group box 1-like 1 HMGB2 0.053 high-mobility group box 2 HMGB2 0.053 high-mobility group box 2 HMGB2 0.053 high-mobility group box 2 SP100 0.051 nuclear antigen Sp100 isoform 2 TOX 0.051 thymus high mobility group box protein TOX HMG20A 0.049 high-mobility group 20A PMS1 0.049 postmeiotic segregation 1 isoform b PMS1 0.049 postmeiotic segregation 1 isoform a LOC729595 0.046 PREDICTED: similar to high mobility group box 3 [Ho... LOC729595 0.046 PREDICTED: similar to high mobility group box 3 [Ho... LOC729595 0.046 PREDICTED: similar to high mobility group box 3 iso... TOX4 0.046 epidermal Langerhans cell protein LCP1Human BLASTP results (used to prepare the table) | |||
Gene descriptions are from NCBI RefSeq. Search results were obtained with NCBI BLAST and RefSeq entries. When identical proteins are present, the self-match may not be listed first in BLASTP output. In such cases, the table above has been reordered to place it first.
See About the Figures for the scoring system used in the figure above right. The same scoring system was used in the table of BLASTP results.
Guide to the Human Genome
Copyright © 2010 by Stewart Scherer. All rights reserved.
