
| Name: KIAA1543 | Sequence: fasta or formatted (1249aa) | NCBI GI: 130502140 | |
|
Description: NEZHA isoform 2
|
Referenced in: Additional Structural Proteins
| ||
Other entries for this name:
alt prot [1276aa] NEZHA isoform 1 | |||
|
Composition:
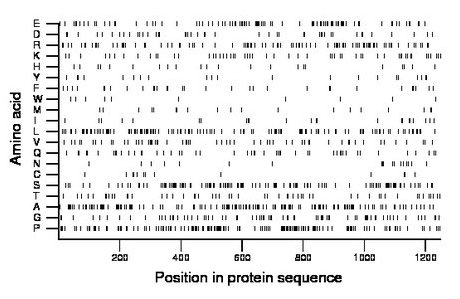
Amino acid Percentage Count Longest homopolymer A alanine 11.6 145 3 C cysteine 1.1 14 2 D aspartate 3.8 48 2 E glutamate 7.9 99 3 F phenylalanine 2.5 31 2 G glycine 6.5 81 3 H histidine 1.8 22 1 I isoleucine 1.9 24 2 K lysine 4.6 57 2 L leucine 9.9 124 3 M methionine 1.6 20 1 N asparagine 1.5 19 2 P proline 12.0 150 3 Q glutamine 4.0 50 3 R arginine 7.8 98 3 S serine 9.6 120 3 T threonine 4.5 56 2 V valine 4.8 60 2 W tryptophan 0.8 10 1 Y tyrosine 1.7 21 1 |
Comparative genomics:
Search single species RefSeq proteins at NCBI
Search summary 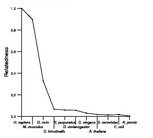
Figure data | ||
Related human proteins:Protein Relative score Description Self-match 1.000 NEZHA isoform 2 KIAA1543 0.994 NEZHA isoform 1 CAMSAP1L1 0.260 calmodulin regulated spectrin-associated protein 1-l... CAMSAP1 0.138 calmodulin regulated spectrin-associated protein 1 ... NACA 0.019 nascent polypeptide-associated complex alpha subuni... MLL2 0.019 myeloid/lymphoid or mixed-lineage leukemia 2 NEFH 0.018 neurofilament, heavy polypeptide 200kDa SRRM1 0.017 serine/arginine repetitive matrix 1 PCLO 0.017 piccolo isoform 2 PCLO 0.017 piccolo isoform 1 GLTSCR1 0.016 glioma tumor suppressor candidate region gene 1 [Ho... PELP1 0.015 proline, glutamic acid and leucine rich protein 1 [... C2orf55 0.015 hypothetical protein LOC343990 FLJ22184 0.015 PREDICTED: hypothetical protein FLJ22184 FLJ22184 0.015 PREDICTED: hypothetical protein FLJ22184 FSCB 0.015 fibrous sheath CABYR binding protein PRG4 0.014 proteoglycan 4 isoform D PRG4 0.014 proteoglycan 4 isoform C PRG4 0.014 proteoglycan 4 isoform B PRG4 0.014 proteoglycan 4 isoform A BAT2 0.014 HLA-B associated transcript-2 ANKRD11 0.014 ankyrin repeat domain 11 FLJ22184 0.014 PREDICTED: hypothetical protein LOC80164 MAP7D1 0.014 MAP7 domain containing 1 SPEG 0.014 SPEG complex locus ENAH 0.014 enabled homolog isoform b MLL4 0.014 myeloid/lymphoid or mixed-lineage leukemia 4 CASKIN2 0.014 cask-interacting protein 2 isoform b CASKIN2 0.014 cask-interacting protein 2 isoform a SAMD1 0.014 sterile alpha motif domain containing 1Human BLASTP results (used to prepare the table) | |||
Gene descriptions are from NCBI RefSeq. Search results were obtained with NCBI BLAST and RefSeq entries. When identical proteins are present, the self-match may not be listed first in BLASTP output. In such cases, the table above has been reordered to place it first.
See About the Figures for the scoring system used in the figure above right. The same scoring system was used in the table of BLASTP results.
Guide to the Human Genome
Copyright © 2010 by Stewart Scherer. All rights reserved.
