
| Name: CAMSAP1 | Sequence: fasta or formatted (1602aa) | NCBI GI: 186659512 | |
|
Description: calmodulin regulated spectrin-associated protein 1
|
Referenced in: Additional Structural Proteins
| ||
|
Composition:
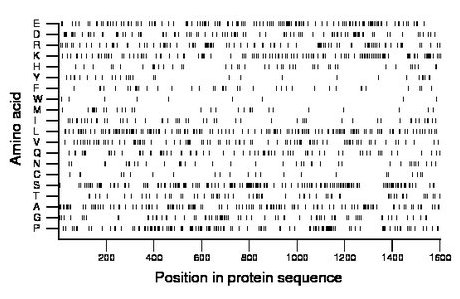
Amino acid Percentage Count Longest homopolymer A alanine 8.2 131 3 C cysteine 1.5 24 2 D aspartate 6.0 96 2 E glutamate 8.7 140 4 F phenylalanine 2.6 41 3 G glycine 4.6 74 2 H histidine 2.7 44 2 I isoleucine 3.4 54 2 K lysine 7.7 123 3 L leucine 9.2 148 3 M methionine 1.9 31 2 N asparagine 2.4 38 2 P proline 7.4 119 2 Q glutamine 4.9 78 3 R arginine 6.0 96 2 S serine 10.3 165 4 T threonine 4.1 66 2 V valine 5.8 93 2 W tryptophan 0.6 10 2 Y tyrosine 1.9 31 2 |
Comparative genomics:
Search single species RefSeq proteins at NCBI
Search summary 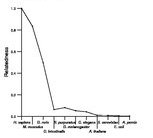
Figure data | ||
Related human proteins:Protein Relative score Description Self-match 1.000 calmodulin regulated spectrin-associated protein 1 ... CAMSAP1L1 0.170 calmodulin regulated spectrin-associated protein 1-l... KIAA1543 0.108 NEZHA isoform 2 KIAA1543 0.108 NEZHA isoform 1 MAP7 0.011 microtubule-associated protein 7 PHLDB1 0.009 pleckstrin homology-like domain, family B, member 1... PHLDB1 0.009 pleckstrin homology-like domain, family B, member 1 ... DDRGK1 0.009 DDRGK domain containing 1 TCHH 0.009 trichohyalin ARGLU1 0.009 arginine and glutamate rich 1 MAP4K4 0.009 mitogen-activated protein kinase kinase kinase kinas... GIGYF2 0.008 GRB10 interacting GYF protein 2 isoform c GIGYF2 0.008 GRB10 interacting GYF protein 2 isoform a GIGYF2 0.008 GRB10 interacting GYF protein 2 isoform b GIGYF2 0.008 GRB10 interacting GYF protein 2 isoform b ACBD3 0.008 acyl-Coenzyme A binding domain containing 3 ACIN1 0.008 apoptotic chromatin condensation inducer 1 USP8 0.008 ubiquitin specific peptidase 8 USP8 0.008 ubiquitin specific peptidase 8 USP8 0.008 ubiquitin specific peptidase 8 MAP1B 0.008 microtubule-associated protein 1B CEP164 0.008 centrosomal protein 164kDa EIF5B 0.008 eukaryotic translation initiation factor 5B MAP7D2 0.008 MAP7 domain containing 2 PLEC1 0.007 plectin 1 isoform 11 PLEC1 0.007 plectin 1 isoform 10 PLEC1 0.007 plectin 1 isoform 8 PLEC1 0.007 plectin 1 isoform 7 PLEC1 0.007 plectin 1 isoform 6 PLEC1 0.007 plectin 1 isoform 3Human BLASTP results (used to prepare the table) | |||
Gene descriptions are from NCBI RefSeq. Search results were obtained with NCBI BLAST and RefSeq entries. When identical proteins are present, the self-match may not be listed first in BLASTP output. In such cases, the table above has been reordered to place it first.
See About the Figures for the scoring system used in the figure above right. The same scoring system was used in the table of BLASTP results.
Guide to the Human Genome
Copyright © 2010 by Stewart Scherer. All rights reserved.
