
| Name: ACTA1 | Sequence: fasta or formatted (377aa) | NCBI GI: 4501881 | |
|
Description: actin, alpha 1, skeletal muscle
|
Referenced in:
| ||
|
Composition:
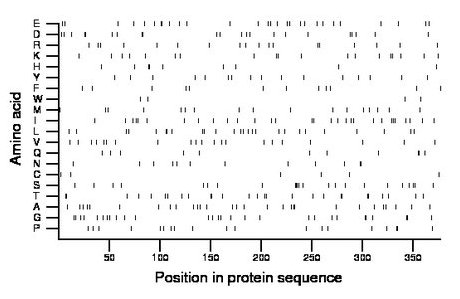
Amino acid Percentage Count Longest homopolymer A alanine 7.7 29 2 C cysteine 1.6 6 1 D aspartate 5.8 22 2 E glutamate 7.4 28 2 F phenylalanine 3.2 12 1 G glycine 7.4 28 2 H histidine 2.4 9 2 I isoleucine 8.0 30 2 K lysine 5.0 19 1 L leucine 6.9 26 2 M methionine 4.5 17 1 N asparagine 3.2 12 2 P proline 5.0 19 2 Q glutamine 2.9 11 2 R arginine 4.8 18 1 S serine 6.1 23 4 T threonine 7.2 27 2 V valine 5.6 21 1 W tryptophan 1.1 4 1 Y tyrosine 4.2 16 1 |
Comparative genomics:
Search single species RefSeq proteins at NCBI
Search summary 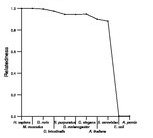
Figure data | ||
Related human proteins:Protein Relative score Description Self-match 1.000 actin, alpha 1, skeletal muscle ACTC1 0.992 cardiac muscle alpha actin 1 proprotein ACTA2 0.984 alpha 2 actin ACTA2 0.984 alpha 2 actin ACTG2 0.977 actin, gamma 2 propeptide ACTG1 0.941 actin, gamma 1 propeptide ACTB 0.939 beta actin ACTBL2 0.893 actin, beta-like 2 POTEE 0.870 protein expressed in prostate, ovary, testis, and p... ACTBL3 0.869 PREDICTED: actin, beta-like 3 ACTBL3 0.869 PREDICTED: kappa-actin LOC653269 0.865 PREDICTED: similar to protein expressed in prostate... LOC653269 0.865 PREDICTED: similar to protein expressed in prostate,... ACTBL3 0.865 PREDICTED: actin, beta-like 3 POTEF 0.862 prostate, ovary, testis expressed protein on chromo... LOC653781 0.857 PREDICTED: similar to protein expressed in prostate... ACTR1B 0.547 ARP1 actin-related protein 1 homolog B, centractin b... ACTR1A 0.538 ARP1 actin-related protein 1 homolog A, centractin al... ARPM1 0.492 actin related protein M1 LOC100128069 0.478 PREDICTED: similar to alpha actin LOC100128069 0.464 PREDICTED: similar to Actin, alpha 1, skeletal musc... ACTRT1 0.461 actin-related protein T1 ACTRT2 0.457 actin-related protein M2 ACTR2 0.454 actin-related protein 2 isoform b ACTR2 0.449 actin-related protein 2 isoform a ACTL7A 0.399 actin-like 7A ACTL7B 0.385 actin-like 7B ACTL9 0.369 actin-like 9 ACTL6B 0.311 actin-like 6B ACTR3B 0.305 actin-related protein 3-beta isoform 1Human BLASTP results (used to prepare the table) | |||
Gene descriptions are from NCBI RefSeq. Search results were obtained with NCBI BLAST and RefSeq entries. When identical proteins are present, the self-match may not be listed first in BLASTP output. In such cases, the table above has been reordered to place it first.
See About the Figures for the scoring system used in the figure above right. The same scoring system was used in the table of BLASTP results.
Guide to the Human Genome
Copyright © 2010 by Stewart Scherer. All rights reserved.
