
| Name: TWSG1 | Sequence: fasta or formatted (223aa) | NCBI GI: 10190664 | |
|
Description: twisted gastrulation
|
Referenced in: Additional Genes in Development
| ||
|
Composition:
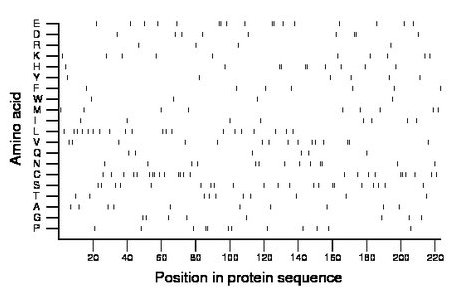
Amino acid Percentage Count Longest homopolymer A alanine 4.5 10 1 C cysteine 10.8 24 2 D aspartate 4.0 9 2 E glutamate 7.6 17 2 F phenylalanine 3.1 7 1 G glycine 3.6 8 1 H histidine 4.5 10 2 I isoleucine 3.6 8 1 K lysine 4.5 10 1 L leucine 9.0 20 1 M methionine 4.0 9 1 N asparagine 5.8 13 2 P proline 5.4 12 2 Q glutamine 2.7 6 1 R arginine 1.8 4 1 S serine 9.4 21 2 T threonine 4.5 10 1 V valine 6.7 15 2 W tryptophan 1.8 4 1 Y tyrosine 2.7 6 1 |
Comparative genomics:
Search single species RefSeq proteins at NCBI
Search summary 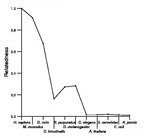
Figure data | ||
Related human proteins:Protein Relative score Description Self-match 1.000 twisted gastrulation VWDE 0.024 von Willebrand factor D and EGF domains KRTAP5-3 0.019 keratin associated protein 5-3 KCP 0.017 cysteine rich BMP regulator 2 isoform 1 CORIN 0.017 corin KRTAP5-8 0.017 keratin associated protein 5-8 KRTAP5-1 0.017 keratin associated protein 5-1 SSPO 0.017 SCO-spondin TNFRSF1B 0.015 tumor necrosis factor receptor 2 precursor MDFI 0.015 MyoD family inhibitor KRTAP5-9 0.015 keratin associated protein 5-9 KRTAP5-7 0.015 keratin associated protein 5-7 KRTAP5-2 0.015 keratin associated protein 5-2 PEAR1 0.015 platelet endothelial aggregation receptor 1 MEGF10 0.013 multiple EGF-like-domains 10 NTN4 0.013 netrin 4 THSD7B 0.013 thrombospondin, type I, domain containing 7B LOC100132423 0.011 PREDICTED: hypothetical protein, partial NOTCH4 0.011 notch4 preproprotein ITGB7 0.011 integrin, beta 7 KRTAP5-5 0.011 keratin associated protein 5-5 GIYD1 0.011 GIY-YIG domain containing 1 isoform 2 GIYD1 0.011 GIY-YIG domain containing 1 isoform 1 KRTAP4-8 0.011 PREDICTED: keratin associated protein 4-8 isoform 3... KRTAP4-8 0.011 PREDICTED: keratin associated protein 4-8 isoform 2... KRTAP4-8 0.011 PREDICTED: keratin associated protein 4-8 isoform 1... LOC100134267 0.011 PREDICTED: similar to keratin associated protein 4-... LOC100134267 0.011 PREDICTED: similar to keratin associated protein 4-... LOC100134267 0.011 PREDICTED: similar to keratin associated protein 4-... LRP4 0.011 low density lipoprotein receptor-related protein 4 ...Human BLASTP results (used to prepare the table) | |||
Gene descriptions are from NCBI RefSeq. Search results were obtained with NCBI BLAST and RefSeq entries. When identical proteins are present, the self-match may not be listed first in BLASTP output. In such cases, the table above has been reordered to place it first.
See About the Figures for the scoring system used in the figure above right. The same scoring system was used in the table of BLASTP results.
Guide to the Human Genome
Copyright © 2010 by Stewart Scherer. All rights reserved.
