
| Name: OPN5 | Sequence: fasta or formatted (189aa) | NCBI GI: 71999146 | |
|
Description: opsin 5 isoform 2
|
Referenced in: Photoreceptors and Related Functions
| ||
Other entries for this name:
alt prot [354aa] opsin 5 isoform 1 | |||
|
Composition:
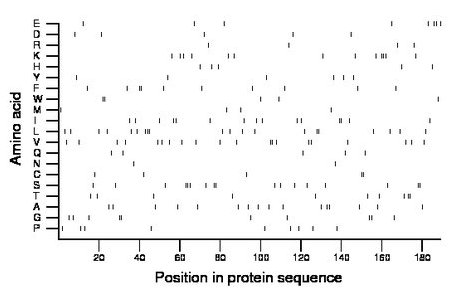
Amino acid Percentage Count Longest homopolymer A alanine 8.5 16 2 C cysteine 2.6 5 2 D aspartate 2.6 5 1 E glutamate 4.2 8 2 F phenylalanine 5.3 10 2 G glycine 5.3 10 2 H histidine 2.6 5 1 I isoleucine 7.9 15 2 K lysine 6.9 13 3 L leucine 10.6 20 3 M methionine 2.1 4 1 N asparagine 1.1 2 1 P proline 4.8 9 1 Q glutamine 2.6 5 1 R arginine 2.1 4 1 S serine 9.0 17 3 T threonine 5.3 10 2 V valine 10.6 20 2 W tryptophan 2.6 5 2 Y tyrosine 3.2 6 1 |
Comparative genomics:
Search single species RefSeq proteins at NCBI
Search summary 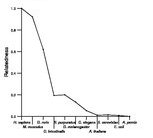
Figure data | ||
Related human proteins:Protein Relative score Description Self-match 1.000 opsin 5 isoform 2 OPN5 1.000 opsin 5 isoform 1 RRH 0.191 peropsin RHO 0.160 rhodopsin OPN1SW 0.160 opsin 1 (cone pigments), short-wave-sensitive OPN4 0.138 opsin 4 isoform 2 OPN4 0.138 opsin 4 isoform 1 OPN3 0.135 opsin 3 OPN1MW2 0.132 opsin 1 (cone pigments), medium-wave-sensitive 2 [H... OPN1MW 0.132 opsin 1 (cone pigments), medium-wave-sensitive OPN1LW 0.132 opsin 1 (cone pigments), long-wave-sensitive RGR 0.090 retinal G-protein coupled receptor isoform 2 RGR 0.090 retinal G-protein coupled receptor isoform 1 SSTR1 0.076 somatostatin receptor 1 SSTR2 0.070 somatostatin receptor 2 SSTR4 0.067 somatostatin receptor 4 MCHR1 0.065 G protein-coupled receptor 24 GALR1 0.065 galanin receptor 1 NPY2R 0.062 neuropeptide Y receptor Y2 HRH2 0.059 histamine receptor H2 isoform 1 HRH2 0.059 histamine receptor H2 isoform 2 TAAR9 0.056 trace amine associated receptor 9 TACR1 0.056 tachykinin receptor 1 isoform long SSTR3 0.053 somatostatin receptor 3 TACR2 0.053 tachykinin receptor 2 TACR1 0.051 tachykinin receptor 1 isoform short RXFP4 0.048 relaxin 3 receptor 2 SSTR5 0.045 somatostatin receptor 5 PRLHR 0.045 G protein-coupled receptor 10 DRD4 0.045 dopamine receptor D4Human BLASTP results (used to prepare the table) | |||
Gene descriptions are from NCBI RefSeq. Search results were obtained with NCBI BLAST and RefSeq entries. When identical proteins are present, the self-match may not be listed first in BLASTP output. In such cases, the table above has been reordered to place it first.
See About the Figures for the scoring system used in the figure above right. The same scoring system was used in the table of BLASTP results.
Guide to the Human Genome
Copyright © 2010 by Stewart Scherer. All rights reserved.
