
| Name: TACR1 | Sequence: fasta or formatted (311aa) | NCBI GI: 7669546 | |
|
Description: tachykinin receptor 1 isoform short
|
Referenced in: Peptide and Protein G-coupled Signals
| ||
Other entries for this name:
alt prot [407aa] tachykinin receptor 1 isoform long | |||
|
Composition:
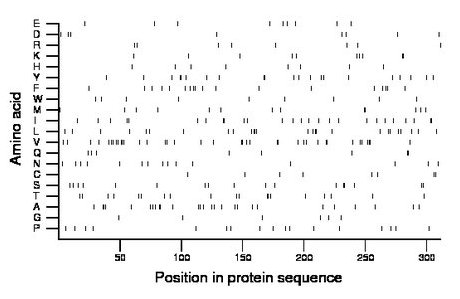
Amino acid Percentage Count Longest homopolymer A alanine 8.7 27 3 C cysteine 2.6 8 2 D aspartate 2.6 8 1 E glutamate 2.9 9 1 F phenylalanine 5.8 18 2 G glycine 1.9 6 1 H histidine 2.6 8 1 I isoleucine 8.4 26 2 K lysine 3.2 10 2 L leucine 8.4 26 3 M methionine 4.2 13 2 N asparagine 4.8 15 1 P proline 5.5 17 1 Q glutamine 2.6 8 2 R arginine 2.6 8 1 S serine 5.5 17 2 T threonine 6.1 19 2 V valine 12.2 38 3 W tryptophan 2.9 9 1 Y tyrosine 6.8 21 2 |
Comparative genomics:
Search single species RefSeq proteins at NCBI
Search summary 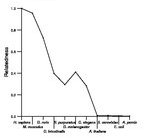
Figure data | ||
Related human proteins:Protein Relative score Description Self-match 1.000 tachykinin receptor 1 isoform short TACR1 1.000 tachykinin receptor 1 isoform long TACR3 0.657 tachykinin receptor 3 TACR2 0.541 tachykinin receptor 2 GPR83 0.250 G protein-coupled receptor 83 NPY2R 0.216 neuropeptide Y receptor Y2 PRLHR 0.203 G protein-coupled receptor 10 QRFPR 0.188 G protein-coupled receptor 103 HCRTR2 0.183 orexin receptor 2 NPFFR2 0.183 neuropeptide FF receptor 2 isoform 2 NPFFR2 0.183 neuropeptide FF receptor 2 isoform 1 NPFFR2 0.183 neuropeptide FF receptor 2 isoform 3 PROKR2 0.180 prokineticin receptor 2 PROKR1 0.179 G protein-coupled receptor 73 BRS3 0.175 bombesin-like receptor 3 HCRTR1 0.170 orexin receptor 1 OPRD1 0.170 opioid receptor, delta 1 OPRK1 0.170 opioid receptor, kappa 1 GRPR 0.166 gastrin-releasing peptide receptor NPY1R 0.164 neuropeptide Y receptor Y1 OPRM1 0.162 opioid receptor, mu 1 isoform MOR-1H OPRM1 0.162 opioid receptor, mu 1 isoform MOR-1 OPRM1 0.162 opioid receptor, mu 1 isoform MOR-1B5 OPRM1 0.162 opioid receptor, mu 1 isoform MOR-1B2 OPRM1 0.162 opioid receptor, mu 1 isoform MOR-1B3 OPRM1 0.162 opioid receptor, mu 1 isoform MOR-1B1 OPRM1 0.162 opioid receptor, mu 1 isoform MOR-1A OPRM1 0.162 opioid receptor, mu 1 isoform MOR-1B4 OPRM1 0.162 opioid receptor, mu 1 isoform MOR-1O OPRM1 0.162 opioid receptor, mu 1 isoform MOR-1XHuman BLASTP results (used to prepare the table) | |||
Gene descriptions are from NCBI RefSeq. Search results were obtained with NCBI BLAST and RefSeq entries. When identical proteins are present, the self-match may not be listed first in BLASTP output. In such cases, the table above has been reordered to place it first.
See About the Figures for the scoring system used in the figure above right. The same scoring system was used in the table of BLASTP results.
Guide to the Human Genome
Copyright © 2010 by Stewart Scherer. All rights reserved.
