
| Name: GALR1 | Sequence: fasta or formatted (349aa) | NCBI GI: 167000885 | |
|
Description: galanin receptor 1
|
Referenced in: Peptide and Protein G-coupled Signals
| ||
|
Composition:
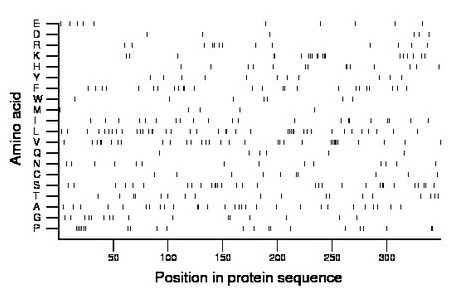
Amino acid Percentage Count Longest homopolymer A alanine 8.3 29 2 C cysteine 2.9 10 1 D aspartate 1.7 6 1 E glutamate 2.9 10 1 F phenylalanine 7.2 25 2 G glycine 4.6 16 1 H histidine 4.0 14 2 I isoleucine 6.0 21 2 K lysine 5.7 20 3 L leucine 11.5 40 3 M methionine 1.4 5 1 N asparagine 4.0 14 1 P proline 6.0 21 2 Q glutamine 1.7 6 1 R arginine 3.7 13 2 S serine 8.9 31 3 T threonine 5.2 18 2 V valine 9.2 32 5 W tryptophan 2.0 7 1 Y tyrosine 3.2 11 1 |
Comparative genomics:
Search single species RefSeq proteins at NCBI
Search summary 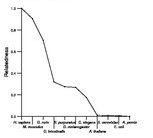
Figure data | ||
Related human proteins:Protein Relative score Description Self-match 1.000 galanin receptor 1 GALR2 0.326 galanin receptor 2 GALR3 0.294 galanin receptor 3 KISS1R 0.246 G protein-coupled receptor 54 SSTR2 0.219 somatostatin receptor 2 SSTR5 0.214 somatostatin receptor 5 SSTR4 0.209 somatostatin receptor 4 OPRK1 0.202 opioid receptor, kappa 1 OPRM1 0.202 opioid receptor, mu 1 isoform MOR-1H OPRM1 0.202 opioid receptor, mu 1 isoform MOR-1 OPRM1 0.202 opioid receptor, mu 1 isoform MOR-1B5 OPRM1 0.202 opioid receptor, mu 1 isoform MOR-1B2 OPRM1 0.202 opioid receptor, mu 1 isoform MOR-1B3 OPRM1 0.202 opioid receptor, mu 1 isoform MOR-1B1 OPRM1 0.202 opioid receptor, mu 1 isoform MOR-1A OPRM1 0.202 opioid receptor, mu 1 isoform MOR-1B4 OPRM1 0.202 opioid receptor, mu 1 isoform MOR-1O OPRM1 0.202 opioid receptor, mu 1 isoform MOR-1X OPRD1 0.199 opioid receptor, delta 1 SSTR3 0.198 somatostatin receptor 3 BRS3 0.198 bombesin-like receptor 3 QRFPR 0.189 G protein-coupled receptor 103 PRLHR 0.189 G protein-coupled receptor 10 GRPR 0.189 gastrin-releasing peptide receptor LOC100293905 0.189 PREDICTED: similar to gastrin-releasing peptide rec... OPRL1 0.189 opiate receptor-like 1 OPRL1 0.189 opiate receptor-like 1 SSTR1 0.185 somatostatin receptor 1 OPRM1 0.183 opioid receptor, mu 1 isoform MOR-1G2 NPY2R 0.182 neuropeptide Y receptor Y2Human BLASTP results (used to prepare the table) | |||
Gene descriptions are from NCBI RefSeq. Search results were obtained with NCBI BLAST and RefSeq entries. When identical proteins are present, the self-match may not be listed first in BLASTP output. In such cases, the table above has been reordered to place it first.
See About the Figures for the scoring system used in the figure above right. The same scoring system was used in the table of BLASTP results.
Guide to the Human Genome
Copyright © 2010 by Stewart Scherer. All rights reserved.
