
| Name: RXFP4 | Sequence: fasta or formatted (374aa) | NCBI GI: 32490567 | |
|
Description: relaxin 3 receptor 2
|
Referenced in: Peptide and Protein G-coupled Signals
| ||
|
Composition:
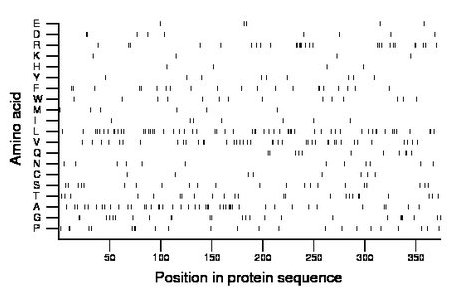
Amino acid Percentage Count Longest homopolymer A alanine 11.8 44 4 C cysteine 2.1 8 1 D aspartate 2.4 9 2 E glutamate 1.3 5 1 F phenylalanine 5.6 21 2 G glycine 6.7 25 3 H histidine 1.1 4 1 I isoleucine 1.9 7 1 K lysine 1.1 4 1 L leucine 15.5 58 4 M methionine 1.6 6 1 N asparagine 3.2 12 1 P proline 6.1 23 2 Q glutamine 2.9 11 2 R arginine 7.5 28 3 S serine 5.9 22 1 T threonine 6.4 24 2 V valine 10.7 40 2 W tryptophan 3.7 14 1 Y tyrosine 2.4 9 1 |
Comparative genomics:
Search single species RefSeq proteins at NCBI
Search summary 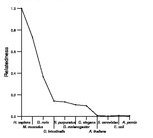
Figure data | ||
Related human proteins:Protein Relative score Description Self-match 1.000 relaxin 3 receptor 2 RXFP3 0.317 relaxin/insulin-like family peptide receptor 3 SSTR3 0.172 somatostatin receptor 3 SSTR4 0.164 somatostatin receptor 4 AGTR1 0.164 angiotensin II receptor, type 1 AGTR1 0.164 angiotensin II receptor, type 1 AGTR1 0.164 angiotensin II receptor, type 1 AGTR1 0.164 angiotensin II receptor, type 1 AGTR1 0.164 angiotensin II receptor, type 1 OPRD1 0.157 opioid receptor, delta 1 SSTR1 0.156 somatostatin receptor 1 NPBWR1 0.156 G protein-coupled receptor 7 SSTR2 0.154 somatostatin receptor 2 APLNR 0.153 apelin receptor AGTR2 0.150 angiotensin II receptor, type 2 OPRL1 0.147 opiate receptor-like 1 OPRL1 0.147 opiate receptor-like 1 CXCR7 0.139 chemokine orphan receptor 1 CXCR4 0.139 chemokine (C-X-C motif) receptor 4 isoform b CXCR4 0.139 chemokine (C-X-C motif) receptor 4 isoform a SSTR5 0.136 somatostatin receptor 5 BDKRB2 0.135 bradykinin receptor B2 NPBWR2 0.134 neuropeptides B/W receptor 2 GPR25 0.134 G protein-coupled receptor 25 CXCR3 0.132 chemokine (C-X-C motif) receptor 3 isoform B CXCR3 0.132 chemokine (C-X-C motif) receptor 3 isoform A OPRM1 0.132 opioid receptor, mu 1 isoform MOR-1H OPRM1 0.132 opioid receptor, mu 1 isoform MOR-1 OPRM1 0.132 opioid receptor, mu 1 isoform MOR-1B5 OPRM1 0.132 opioid receptor, mu 1 isoform MOR-1B2Human BLASTP results (used to prepare the table) | |||
Gene descriptions are from NCBI RefSeq. Search results were obtained with NCBI BLAST and RefSeq entries. When identical proteins are present, the self-match may not be listed first in BLASTP output. In such cases, the table above has been reordered to place it first.
See About the Figures for the scoring system used in the figure above right. The same scoring system was used in the table of BLASTP results.
Guide to the Human Genome
Copyright © 2010 by Stewart Scherer. All rights reserved.
