
| Name: RHO | Sequence: fasta or formatted (348aa) | NCBI GI: 4506527 | |
|
Description: rhodopsin
|
Referenced in: Photoreceptors and Related Functions
| ||
|
Composition:
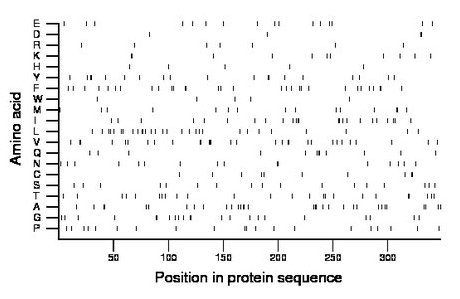
Amino acid Percentage Count Longest homopolymer A alanine 9.2 32 3 C cysteine 2.9 10 2 D aspartate 1.1 4 2 E glutamate 4.6 16 1 F phenylalanine 8.6 30 2 G glycine 6.3 22 2 H histidine 1.4 5 1 I isoleucine 6.9 24 3 K lysine 3.2 11 2 L leucine 8.3 29 2 M methionine 4.3 15 2 N asparagine 4.6 16 2 P proline 5.7 20 2 Q glutamine 3.4 12 3 R arginine 2.0 7 1 S serine 4.9 17 1 T threonine 6.9 24 2 V valine 8.6 30 3 W tryptophan 1.4 5 1 Y tyrosine 5.5 19 2 |
Comparative genomics:
Search single species RefSeq proteins at NCBI
Search summary 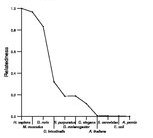
Figure data | ||
Related human proteins:Protein Relative score Description Self-match 1.000 rhodopsin OPN1SW 0.428 opsin 1 (cone pigments), short-wave-sensitive OPN1MW2 0.389 opsin 1 (cone pigments), medium-wave-sensitive 2 [H... OPN1MW 0.389 opsin 1 (cone pigments), medium-wave-sensitive OPN1LW 0.383 opsin 1 (cone pigments), long-wave-sensitive OPN3 0.213 opsin 3 OPN4 0.194 opsin 4 isoform 1 RRH 0.194 peropsin OPN4 0.192 opsin 4 isoform 2 OPN5 0.147 opsin 5 isoform 1 SSTR5 0.135 somatostatin receptor 5 CCKAR 0.123 cholecystokinin A receptor TACR2 0.120 tachykinin receptor 2 SSTR2 0.120 somatostatin receptor 2 TACR3 0.118 tachykinin receptor 3 TACR1 0.115 tachykinin receptor 1 isoform long NPY1R 0.113 neuropeptide Y receptor Y1 NMUR1 0.110 neuromedin U receptor 1 OPRM1 0.109 opioid receptor, mu 1 isoform MOR-1H OPRM1 0.109 opioid receptor, mu 1 isoform MOR-1 OPRM1 0.109 opioid receptor, mu 1 isoform MOR-1B5 OPRM1 0.109 opioid receptor, mu 1 isoform MOR-1B2 OPRM1 0.109 opioid receptor, mu 1 isoform MOR-1B3 OPRM1 0.109 opioid receptor, mu 1 isoform MOR-1B1 TACR1 0.109 tachykinin receptor 1 isoform short OPRM1 0.109 opioid receptor, mu 1 isoform MOR-1A OPRM1 0.109 opioid receptor, mu 1 isoform MOR-1B4 GPR50 0.109 G protein-coupled receptor 50 OPRM1 0.109 opioid receptor, mu 1 isoform MOR-1O OPRM1 0.109 opioid receptor, mu 1 isoform MOR-1XHuman BLASTP results (used to prepare the table) | |||
Gene descriptions are from NCBI RefSeq. Search results were obtained with NCBI BLAST and RefSeq entries. When identical proteins are present, the self-match may not be listed first in BLASTP output. In such cases, the table above has been reordered to place it first.
See About the Figures for the scoring system used in the figure above right. The same scoring system was used in the table of BLASTP results.
Guide to the Human Genome
Copyright © 2010 by Stewart Scherer. All rights reserved.
