
| Name: TFG | Sequence: fasta or formatted (400aa) | NCBI GI: 56090139 | |
|
Description: TRK-fused
|
Referenced in:
| ||
Other entries for this name:
alt mRNA [400aa] TRK-fused | |||
|
Composition:
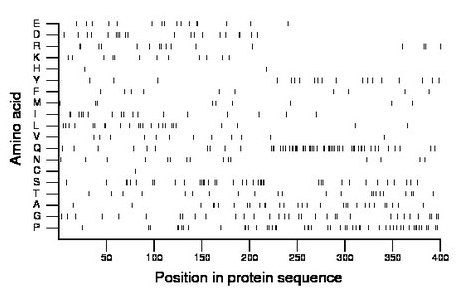
Amino acid Percentage Count Longest homopolymer A alanine 7.5 30 2 C cysteine 0.2 1 1 D aspartate 5.0 20 2 E glutamate 4.0 16 2 F phenylalanine 2.5 10 1 G glycine 8.2 33 1 H histidine 0.5 2 1 I isoleucine 4.2 17 2 K lysine 3.0 12 1 L leucine 6.0 24 2 M methionine 2.2 9 2 N asparagine 3.8 15 1 P proline 12.2 49 3 Q glutamine 13.8 55 3 R arginine 4.0 16 2 S serine 9.5 38 4 T threonine 5.5 22 1 V valine 3.0 12 1 W tryptophan 0.0 0 0 Y tyrosine 4.8 19 1 |
Comparative genomics:
Search single species RefSeq proteins at NCBI
Search summary 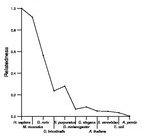
Figure data | ||
Related human proteins:Protein Relative score Description Self-match 1.000 TRK-fused TFG 1.000 TRK-fused ARID1A 0.054 AT rich interactive domain 1A isoform a ARID1A 0.054 AT rich interactive domain 1A isoform b PRB2 0.053 proline-rich protein BstNI subfamily 2 PRB1 0.051 proline-rich protein BstNI subfamily 1 isoform 1 pre... PCLO 0.049 piccolo isoform 2 PCLO 0.049 piccolo isoform 1 PRB3 0.049 proline-rich protein BstNI subfamily 3 precursor [H... ATN1 0.046 atrophin-1 ATN1 0.046 atrophin-1 PRB4 0.043 proline-rich protein BstNI subfamily 4 precursor [Ho... SYN1 0.042 synapsin I isoform Ia SYN1 0.042 synapsin I isoform Ib MAML2 0.041 mastermind-like 2 R3HDM2 0.041 R3H domain containing 2 MED15 0.039 mediator complex subunit 15 isoform a MED15 0.039 mediator complex subunit 15 isoform b RBM14 0.039 RNA binding motif protein 14 GRINA 0.038 glutamate receptor, ionotropic, N-methyl D-aspartate... GRINA 0.038 glutamate receptor, ionotropic, N-methyl D-aspartate... AAK1 0.038 AP2 associated kinase 1 SEC16A 0.038 SEC16 homolog A ARID1B 0.037 AT rich interactive domain 1B (SWI1-like) isoform 1 ... ARID1B 0.037 AT rich interactive domain 1B (SWI1-like) isoform 3 ... ZNF469 0.037 zinc finger protein 469 RC3H1 0.037 roquin WNK1 0.035 WNK lysine deficient protein kinase 1 SMARCA2 0.035 SWI/SNF-related matrix-associated actin-dependent re... SMARCA2 0.035 SWI/SNF-related matrix-associated actin-dependent re...Human BLASTP results (used to prepare the table) | |||
Gene descriptions are from NCBI RefSeq. Search results were obtained with NCBI BLAST and RefSeq entries. When identical proteins are present, the self-match may not be listed first in BLASTP output. In such cases, the table above has been reordered to place it first.
See About the Figures for the scoring system used in the figure above right. The same scoring system was used in the table of BLASTP results.
Guide to the Human Genome
Copyright © 2010 by Stewart Scherer. All rights reserved.
