
| Name: R3HDM2 | Sequence: fasta or formatted (976aa) | NCBI GI: 162951884 | |
|
Description: R3H domain containing 2
| Not currently referenced in the text | ||
|
Composition:
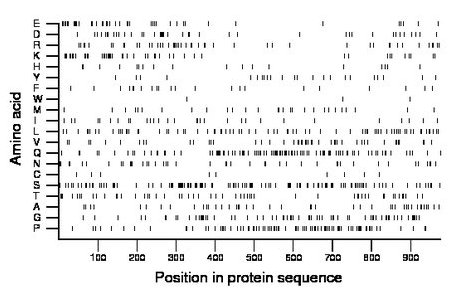
Amino acid Percentage Count Longest homopolymer A alanine 4.8 47 2 C cysteine 0.9 9 1 D aspartate 4.2 41 2 E glutamate 4.3 42 3 F phenylalanine 2.3 22 1 G glycine 7.0 68 5 H histidine 1.8 18 1 I isoleucine 3.3 32 2 K lysine 4.8 47 2 L leucine 7.9 77 2 M methionine 3.1 30 2 N asparagine 4.5 44 3 P proline 9.4 92 2 Q glutamine 11.0 107 10 R arginine 4.9 48 2 S serine 12.6 123 4 T threonine 5.3 52 2 V valine 4.9 48 3 W tryptophan 0.3 3 1 Y tyrosine 2.7 26 2 |
Comparative genomics:
Search single species RefSeq proteins at NCBI
Search summary 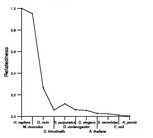
Figure data | ||
Related human proteins:Protein Relative score Description Self-match 1.000 R3H domain containing 2 R3HDM1 0.442 R3H domain containing 1 ARPP-21 0.270 cyclic AMP-regulated phosphoprotein, 21 kD isoform 1... TSC22D1 0.025 TSC22 domain family, member 1 isoform 1 MED15 0.025 mediator complex subunit 15 isoform a GLTSCR1 0.025 glioma tumor suppressor candidate region gene 1 [Ho... MED15 0.024 mediator complex subunit 15 isoform b FLJ22184 0.022 PREDICTED: hypothetical protein FLJ22184 MAML3 0.021 mastermind-like 3 FLJ22184 0.021 PREDICTED: hypothetical protein FLJ22184 CREBBP 0.021 CREB binding protein isoform b CREBBP 0.021 CREB binding protein isoform a WDR33 0.020 WD repeat domain 33 isoform 1 NCOA6 0.020 nuclear receptor coactivator 6 ARID1B 0.020 AT rich interactive domain 1B (SWI1-like) isoform 1 ... ATN1 0.019 atrophin-1 ATN1 0.019 atrophin-1 EP300 0.019 E1A binding protein p300 MAGEC1 0.019 melanoma antigen family C, 1 BCL9L 0.019 B-cell CLL/lymphoma 9-like RERE 0.018 atrophin-1 like protein isoform b RERE 0.018 atrophin-1 like protein isoform a RERE 0.018 atrophin-1 like protein isoform a ARID1B 0.018 AT rich interactive domain 1B (SWI1-like) isoform 2 ... ARID1B 0.018 AT rich interactive domain 1B (SWI1-like) isoform 3 ... ARID1A 0.018 AT rich interactive domain 1A isoform a ARID1A 0.018 AT rich interactive domain 1A isoform b FLJ22184 0.018 PREDICTED: hypothetical protein LOC80164 BRD4 0.018 bromodomain-containing protein 4 isoform long RBM33 0.018 RNA binding motif protein 33Human BLASTP results (used to prepare the table) | |||
Gene descriptions are from NCBI RefSeq. Search results were obtained with NCBI BLAST and RefSeq entries. When identical proteins are present, the self-match may not be listed first in BLASTP output. In such cases, the table above has been reordered to place it first.
See About the Figures for the scoring system used in the figure above right. The same scoring system was used in the table of BLASTP results.
Guide to the Human Genome
Copyright © 2010 by Stewart Scherer. All rights reserved.
