
| Name: GPD2 | Sequence: fasta or formatted (727aa) | NCBI GI: 133908616 | |
|
Description: glycerol-3-phosphate dehydrogenase 2, mitochondrial
|
Referenced in: Calmodulin and Calcium
| ||
Other entries for this name:
alt mRNA [727aa] glycerol-3-phosphate dehydrogenase 2, mitochondrial | |||
|
Composition:
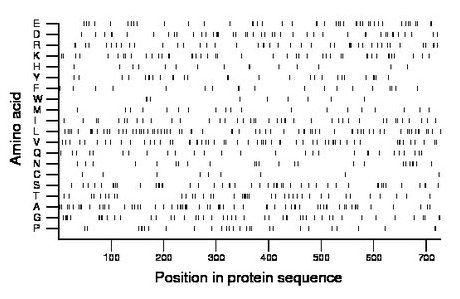
Amino acid Percentage Count Longest homopolymer A alanine 8.8 64 3 C cysteine 1.2 9 1 D aspartate 6.1 44 2 E glutamate 5.9 43 2 F phenylalanine 2.6 19 2 G glycine 6.9 50 3 H histidine 2.1 15 2 I isoleucine 5.6 41 1 K lysine 6.1 44 2 L leucine 9.8 71 2 M methionine 2.8 20 1 N asparagine 3.3 24 1 P proline 4.0 29 2 Q glutamine 3.9 28 1 R arginine 5.9 43 2 S serine 6.6 48 2 T threonine 5.6 41 2 V valine 7.8 57 2 W tryptophan 1.2 9 2 Y tyrosine 3.9 28 2 |
Comparative genomics:
Search single species RefSeq proteins at NCBI
Search summary 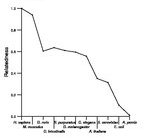
Figure data | ||
Related human proteins:Protein Relative score Description Self-match 1.000 glycerol-3-phosphate dehydrogenase 2, mitochondrial... GPD2 1.000 glycerol-3-phosphate dehydrogenase 2, mitochondrial... CABP1 0.017 calcium binding protein 1 isoform 2 CALM3 0.016 calmodulin 3 CALM2 0.016 calmodulin 2 CABP1 0.016 calcium binding protein 1 isoform 1 CALM1 0.016 calmodulin 1 CABP1 0.016 calcium binding protein 1 isoform 3 CALML5 0.015 calmodulin-like 5 DMGDH 0.015 dimethylglycine dehydrogenase precursor CALML3 0.014 calmodulin-like 3 PPEF2 0.014 serine/threonine protein phosphatase with EF-hand mo... CABP7 0.013 calcium binding protein 7 PLCD4 0.013 phospholipase C, delta 4 CABP5 0.013 calcium binding protein 5 CALN1 0.013 calneuron 1 isoform 2 CALN1 0.013 calneuron 1 isoform 1 PLS1 0.013 plastin 1 PLS1 0.013 plastin 1 CETN2 0.012 caltractin PPEF1 0.012 protein phosphatase with EF hand calcium-binding dom... PPEF1 0.012 protein phosphatase with EF hand calcium-binding dom... PPEF1 0.012 protein phosphatase with EF hand calcium-binding dom... CETN1 0.012 centrin 1 RHBDL3 0.012 rhomboid protease 3 TNNC1 0.012 troponin C, slow CABP4 0.011 calcium binding protein 4 SLC25A24 0.011 solute carrier family 25 member 24 isoform 1 AIF1 0.011 allograft inflammatory factor 1 isoform 3 CABP2 0.011 calcium binding protein 2 isoform 2Human BLASTP results (used to prepare the table) | |||
Gene descriptions are from NCBI RefSeq. Search results were obtained with NCBI BLAST and RefSeq entries. When identical proteins are present, the self-match may not be listed first in BLASTP output. In such cases, the table above has been reordered to place it first.
See About the Figures for the scoring system used in the figure above right. The same scoring system was used in the table of BLASTP results.
Guide to the Human Genome
Copyright © 2010 by Stewart Scherer. All rights reserved.
