
| Name: MTA3 | Sequence: fasta or formatted (515aa) | NCBI GI: 50838795 | |
|
Description: metastasis associated 1 family, member 3
|
Referenced in: Histones, Related Proteins, and Modifying Enzymes
| ||
|
Composition:
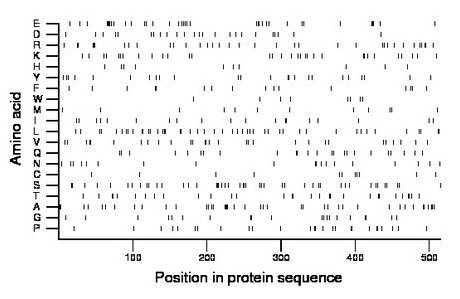
Amino acid Percentage Count Longest homopolymer A alanine 8.2 42 4 C cysteine 2.1 11 1 D aspartate 4.7 24 1 E glutamate 7.4 38 3 F phenylalanine 3.3 17 2 G glycine 3.9 20 2 H histidine 1.9 10 1 I isoleucine 3.7 19 2 K lysine 6.2 32 2 L leucine 9.1 47 2 M methionine 2.5 13 1 N asparagine 3.7 19 1 P proline 5.0 26 2 Q glutamine 4.7 24 2 R arginine 6.8 35 3 S serine 8.9 46 3 T threonine 5.8 30 2 V valine 5.6 29 2 W tryptophan 1.6 8 1 Y tyrosine 4.9 25 3 |
Comparative genomics:
Search single species RefSeq proteins at NCBI
Search summary 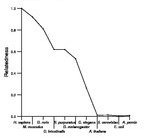
Figure data | ||
Related human proteins:Protein Relative score Description Self-match 1.000 metastasis associated 1 family, member 3 MTA1 0.732 metastasis associated protein MTA2 0.691 metastasis-associated protein 2 RERE 0.134 atrophin-1 like protein isoform a RERE 0.134 atrophin-1 like protein isoform a RCOR1 0.052 REST corepressor 1 MIER2 0.040 mesoderm induction early response 1, family member 2... MIER3 0.038 mesoderm induction early response 1, family member 3... RCOR2 0.038 REST corepressor 2 MIER1 0.038 mesoderm induction early response 1 isoform g [Homo... MIER1 0.038 mesoderm induction early response 1 isoform i [Homo... MIER1 0.038 mesoderm induction early response 1 isoform h [Homo... MIER1 0.038 mesoderm induction early response 1 isoform a [Homo... MIER1 0.038 mesoderm induction early response 1 isoform f [Homo... MIER1 0.038 mesoderm induction early response 1 isoform e [Homo... MIER1 0.038 mesoderm induction early response 1 isoform d [Homo... MIER1 0.038 mesoderm induction early response 1 isoform c [Homo... MIER1 0.038 mesoderm induction early response 1 isoform b [Homo... MIER1 0.038 mesoderm induction early response 1 isoform a [Homo... RCOR3 0.037 REST corepressor 3 isoform c RCOR3 0.037 REST corepressor 3 isoform b RCOR3 0.037 REST corepressor 3 isoform a RCOR3 0.037 REST corepressor 3 isoform d TRERF1 0.026 transcriptional regulating factor 1 ZNF541 0.018 zinc finger protein 541 LOC441644 0.014 PREDICTED: similar to hCG2041217 LOC441644 0.014 PREDICTED: similar to hCG2041217 LOC441644 0.014 PREDICTED: similar to REST corepressor 2 PBRM1 0.011 polybromo 1 isoform 1 PBRM1 0.011 polybromo 1 isoform 4Human BLASTP results (used to prepare the table) | |||
Gene descriptions are from NCBI RefSeq. Search results were obtained with NCBI BLAST and RefSeq entries. When identical proteins are present, the self-match may not be listed first in BLASTP output. In such cases, the table above has been reordered to place it first.
See About the Figures for the scoring system used in the figure above right. The same scoring system was used in the table of BLASTP results.
Guide to the Human Genome
Copyright © 2010 by Stewart Scherer. All rights reserved.
