
| Name: RCOR1 | Sequence: fasta or formatted (482aa) | NCBI GI: 7661892 | |
|
Description: REST corepressor 1
| Not currently referenced in the text | ||
|
Composition:
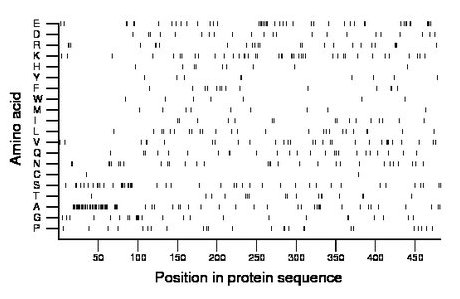
Amino acid Percentage Count Longest homopolymer A alanine 12.9 62 4 C cysteine 0.4 2 1 D aspartate 4.6 22 1 E glutamate 9.3 45 3 F phenylalanine 2.9 14 2 G glycine 5.2 25 4 H histidine 1.9 9 1 I isoleucine 3.3 16 1 K lysine 8.3 40 2 L leucine 5.2 25 2 M methionine 2.1 10 1 N asparagine 6.2 30 2 P proline 5.2 25 2 Q glutamine 5.2 25 2 R arginine 5.2 25 3 S serine 9.1 44 3 T threonine 3.5 17 2 V valine 6.2 30 2 W tryptophan 1.5 7 1 Y tyrosine 1.9 9 2 |
Comparative genomics:
Search single species RefSeq proteins at NCBI
Search summary 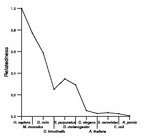
Figure data | ||
Related human proteins:Protein Relative score Description Self-match 1.000 REST corepressor 1 RCOR3 0.517 REST corepressor 3 isoform a RCOR3 0.515 REST corepressor 3 isoform c RCOR3 0.494 REST corepressor 3 isoform d RCOR2 0.432 REST corepressor 2 RCOR3 0.413 REST corepressor 3 isoform b LOC441644 0.098 PREDICTED: similar to hCG2041217 LOC441644 0.098 PREDICTED: similar to hCG2041217 LOC441644 0.098 PREDICTED: similar to REST corepressor 2 NCOR2 0.086 nuclear receptor co-repressor 2 isoform 2 NCOR2 0.086 nuclear receptor co-repressor 2 isoform 1 NCOR1 0.076 nuclear receptor co-repressor 1 MTA3 0.057 metastasis associated 1 family, member 3 MTA2 0.052 metastasis-associated protein 2 MTA1 0.045 metastasis associated protein TRERF1 0.043 transcriptional regulating factor 1 MIER2 0.041 mesoderm induction early response 1, family member 2... ZNF541 0.039 zinc finger protein 541 TNRC18 0.034 trinucleotide repeat containing 18 MIER3 0.034 mesoderm induction early response 1, family member 3... C14orf43 0.034 hypothetical protein LOC91748 C14orf43 0.034 hypothetical protein LOC91748 SP8 0.031 Sp8 transcription factor isoform 1 SP8 0.031 Sp8 transcription factor isoform 2 RERE 0.029 atrophin-1 like protein isoform a RERE 0.029 atrophin-1 like protein isoform a MIER1 0.028 mesoderm induction early response 1 isoform g [Homo... FAM48B1 0.027 hypothetical protein LOC100130302 CNOT3 0.026 CCR4-NOT transcription complex, subunit 3 MIER1 0.025 mesoderm induction early response 1 isoform i [Homo...Human BLASTP results (used to prepare the table) | |||
Gene descriptions are from NCBI RefSeq. Search results were obtained with NCBI BLAST and RefSeq entries. When identical proteins are present, the self-match may not be listed first in BLASTP output. In such cases, the table above has been reordered to place it first.
See About the Figures for the scoring system used in the figure above right. The same scoring system was used in the table of BLASTP results.
Guide to the Human Genome
Copyright © 2010 by Stewart Scherer. All rights reserved.
