
| Name: LMO3 | Sequence: fasta or formatted (145aa) | NCBI GI: 47778935 | |
|
Description: LIM domain only 3
|
Referenced in: Homeobox and Related Proteins
| ||
Other entries for this name:
alt mRNA [145aa] LIM domain only 3 | |||
|
Composition:
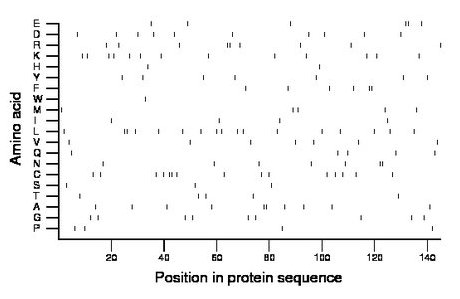
Amino acid Percentage Count Longest homopolymer A alanine 6.9 10 2 C cysteine 10.3 15 2 D aspartate 6.9 10 1 E glutamate 4.1 6 2 F phenylalanine 4.1 6 2 G glycine 6.2 9 1 H histidine 1.4 2 1 I isoleucine 2.8 4 1 K lysine 9.0 13 1 L leucine 11.7 17 2 M methionine 3.4 5 1 N asparagine 4.8 7 2 P proline 2.8 4 1 Q glutamine 3.4 5 1 R arginine 6.2 9 2 S serine 2.1 3 1 T threonine 3.4 5 1 V valine 4.8 7 1 W tryptophan 0.7 1 1 Y tyrosine 4.8 7 1 |
Comparative genomics:
Search single species RefSeq proteins at NCBI
Search summary 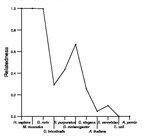
Figure data | ||
Related human proteins:Protein Relative score Description Self-match 1.000 LIM domain only 3 LMO3 1.000 LIM domain only 3 LMO1 0.887 LIM domain only 1 LMO2 0.488 LIM domain only 2 isoform 2 LMO2 0.488 LIM domain only 2 isoform 2 LMO2 0.488 LIM domain only 2 isoform 1 LMO4 0.460 LIM domain only 4 LHX9 0.351 LIM homeobox 9 isoform 1 LHX9 0.351 LIM homeobox 9 isoform 2 LHX4 0.330 LIM homeobox protein 4 LHX2 0.330 LIM homeobox protein 2 LHX3 0.323 LIM homeobox protein 3 isoform a LHX3 0.323 LIM homeobox protein 3 isoform b LMX1B 0.289 LIM homeobox transcription factor 1, beta LMX1A 0.285 LIM homeobox transcription factor 1, alpha isoform a... ISL2 0.282 ISL LIM homeobox 2 LHX1 0.275 LIM homeobox protein 1 ISL1 0.265 islet-1 LHX5 0.261 LIM homeobox protein 5 LHX8 0.258 LIM homeobox 8 LHX6 0.251 LIM homeobox protein 6 isoform 2 LHX6 0.251 LIM homeobox protein 6 isoform 1 ABLIM1 0.196 actin-binding LIM protein 1 isoform c ABLIM1 0.196 actin-binding LIM protein 1 isoform b ABLIM1 0.196 actin-binding LIM protein 1 isoform a ABLIM2 0.168 actin binding LIM protein family, member 2 isoform ... ABLIM2 0.168 actin binding LIM protein family, member 2 isoform ... ABLIM2 0.168 actin binding LIM protein family, member 2 isoform ... ABLIM2 0.168 actin binding LIM protein family, member 2 isoform ... ABLIM2 0.168 actin binding LIM protein family, member 2 isoform ...Human BLASTP results (used to prepare the table) | |||
Gene descriptions are from NCBI RefSeq. Search results were obtained with NCBI BLAST and RefSeq entries. When identical proteins are present, the self-match may not be listed first in BLASTP output. In such cases, the table above has been reordered to place it first.
See About the Figures for the scoring system used in the figure above right. The same scoring system was used in the table of BLASTP results.
Guide to the Human Genome
Copyright © 2010 by Stewart Scherer. All rights reserved.
