
| Name: ISL1 | Sequence: fasta or formatted (349aa) | NCBI GI: 115387114 | |
|
Description: islet-1
|
Referenced in: Homeobox and Related Proteins
| ||
|
Composition:
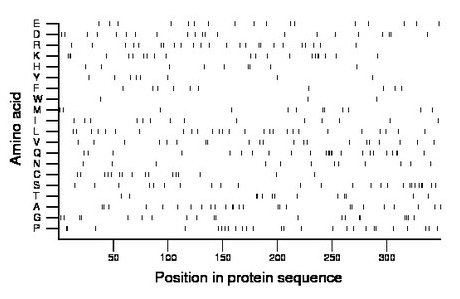
Amino acid Percentage Count Longest homopolymer A alanine 7.4 26 2 C cysteine 4.6 16 1 D aspartate 6.0 21 1 E glutamate 4.9 17 1 F phenylalanine 2.9 10 1 G glycine 5.7 20 2 H histidine 2.6 9 1 I isoleucine 4.0 14 1 K lysine 6.0 21 3 L leucine 7.7 27 1 M methionine 3.4 12 2 N asparagine 3.4 12 1 P proline 7.4 26 2 Q glutamine 6.9 24 4 R arginine 6.9 24 1 S serine 7.2 25 2 T threonine 3.7 13 2 V valine 6.0 21 2 W tryptophan 0.9 3 1 Y tyrosine 2.3 8 1 |
Comparative genomics:
Search single species RefSeq proteins at NCBI
Search summary 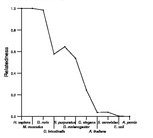
Figure data | ||
Related human proteins:Protein Relative score Description Self-match 1.000 islet-1 ISL2 0.751 ISL LIM homeobox 2 LHX9 0.216 LIM homeobox 9 isoform 1 LHX9 0.216 LIM homeobox 9 isoform 2 LMX1A 0.204 LIM homeobox transcription factor 1, alpha isoform a... LHX2 0.203 LIM homeobox protein 2 LMX1B 0.201 LIM homeobox transcription factor 1, beta LHX1 0.200 LIM homeobox protein 1 LHX5 0.197 LIM homeobox protein 5 LHX3 0.196 LIM homeobox protein 3 isoform b LHX3 0.194 LIM homeobox protein 3 isoform a LHX8 0.193 LIM homeobox 8 LHX6 0.190 LIM homeobox protein 6 isoform 2 LHX6 0.190 LIM homeobox protein 6 isoform 1 LHX4 0.190 LIM homeobox protein 4 LMO4 0.116 LIM domain only 4 LMO3 0.110 LIM domain only 3 LMO3 0.110 LIM domain only 3 LMO1 0.109 LIM domain only 1 LMO2 0.091 LIM domain only 2 isoform 2 LMO2 0.091 LIM domain only 2 isoform 2 LMO2 0.091 LIM domain only 2 isoform 1 LIMK1 0.079 LIM domain kinase 1 ABLIM1 0.077 actin-binding LIM protein 1 isoform c ABLIM1 0.077 actin-binding LIM protein 1 isoform b ABLIM1 0.077 actin-binding LIM protein 1 isoform a LIMK2 0.073 LIM domain kinase 2 isoform 2a ABLIM3 0.070 actin binding LIM protein family, member 3 ABLIM2 0.066 actin binding LIM protein family, member 2 isoform ... ABLIM2 0.066 actin binding LIM protein family, member 2 isoform ...Human BLASTP results (used to prepare the table) | |||
Gene descriptions are from NCBI RefSeq. Search results were obtained with NCBI BLAST and RefSeq entries. When identical proteins are present, the self-match may not be listed first in BLASTP output. In such cases, the table above has been reordered to place it first.
See About the Figures for the scoring system used in the figure above right. The same scoring system was used in the table of BLASTP results.
Guide to the Human Genome
Copyright © 2010 by Stewart Scherer. All rights reserved.
