
| Name: PTTG1 | Sequence: fasta or formatted (202aa) | NCBI GI: 4758980 | |
|
Description: pituitary tumor-transforming protein 1
|
Referenced in: Pituitary
| ||
|
Composition:
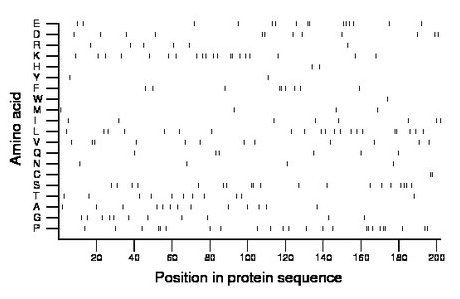
Amino acid Percentage Count Longest homopolymer A alanine 6.4 13 1 C cysteine 1.0 2 2 D aspartate 5.9 12 2 E glutamate 7.4 15 2 F phenylalanine 4.5 9 2 G glycine 5.4 11 1 H histidine 1.0 2 1 I isoleucine 4.0 8 1 K lysine 9.9 20 2 L leucine 10.4 21 2 M methionine 2.0 4 1 N asparagine 2.0 4 1 P proline 11.9 24 2 Q glutamine 3.0 6 1 R arginine 3.0 6 1 S serine 9.4 19 2 T threonine 5.4 11 1 V valine 5.9 12 2 W tryptophan 0.5 1 1 Y tyrosine 1.0 2 1 |
Comparative genomics:
Search single species RefSeq proteins at NCBI
Search summary 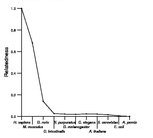
Figure data | ||
Related human proteins:Protein Relative score Description Self-match 1.000 pituitary tumor-transforming protein 1 PTTG2 0.757 pituitary tumor-transforming 2 TCF20 0.031 transcription factor 20 isoform 2 TCF20 0.031 transcription factor 20 isoform 1 CKAP2L 0.026 cytoskeleton associated protein 2-like MLL 0.021 myeloid/lymphoid or mixed-lineage leukemia protein [... ANAPC5 0.018 anaphase-promoting complex subunit 5 isoform b [Hom... ANAPC5 0.018 anaphase-promoting complex subunit 5 isoform a [Homo... GNAS 0.016 GNAS complex locus alex LOC100288540 0.016 PREDICTED: hypothetical protein XP_002342775 KANK4 0.016 ankyrin repeat domain 38 C19orf21 0.016 hypothetical protein LOC126353 CNGB1 0.013 cyclic nucleotide gated channel beta 1 isoform a [H... TCOF1 0.013 Treacher Collins-Franceschetti syndrome 1 isoform f... TCOF1 0.013 Treacher Collins-Franceschetti syndrome 1 isoform e... TCOF1 0.013 Treacher Collins-Franceschetti syndrome 1 isoform d... TCOF1 0.013 Treacher Collins-Franceschetti syndrome 1 isoform b ... TCOF1 0.013 Treacher Collins-Franceschetti syndrome 1 isoform a ... TCOF1 0.013 Treacher Collins-Franceschetti syndrome 1 isoform c ... POM121C 0.013 POM121 membrane glycoprotein (rat)-like WIPF2 0.013 WIRE protein TXNDC2 0.013 thioredoxin domain-containing 2 isoform 1 TXNDC2 0.013 thioredoxin domain-containing 2 isoform 2 TXNDC2 0.013 thioredoxin domain-containing 2 isoform 1 XPO6 0.013 exportin 6 POM121 0.013 nuclear pore membrane protein 121 KIAA1671 0.013 hypothetical protein LOC85379 LOC100289134 0.013 PREDICTED: hypothetical protein XP_002343933 AKNA 0.013 AT-hook transcription factor PHF20L1 0.010 PHD finger protein 20-like 1 isoform 2Human BLASTP results (used to prepare the table) | |||
Gene descriptions are from NCBI RefSeq. Search results were obtained with NCBI BLAST and RefSeq entries. When identical proteins are present, the self-match may not be listed first in BLASTP output. In such cases, the table above has been reordered to place it first.
See About the Figures for the scoring system used in the figure above right. The same scoring system was used in the table of BLASTP results.
Guide to the Human Genome
Copyright © 2010 by Stewart Scherer. All rights reserved.
