
| Name: AKNA | Sequence: fasta or formatted (1439aa) | NCBI GI: 151301137 | |
|
Description: AT-hook transcription factor
|
Referenced in: Hematopoiesis and Erythrocytes
| ||
|
Composition:
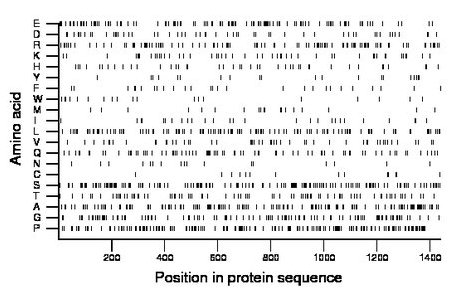
Amino acid Percentage Count Longest homopolymer A alanine 9.9 143 3 C cysteine 1.0 14 1 D aspartate 3.8 55 1 E glutamate 8.7 125 7 F phenylalanine 1.9 27 2 G glycine 7.6 110 3 H histidine 3.0 43 2 I isoleucine 1.9 27 1 K lysine 3.4 49 1 L leucine 8.2 118 2 M methionine 1.4 20 1 N asparagine 1.2 17 1 P proline 12.4 178 3 Q glutamine 5.6 81 2 R arginine 7.2 103 3 S serine 11.0 158 3 T threonine 5.6 81 3 V valine 3.5 50 1 W tryptophan 1.4 20 2 Y tyrosine 1.4 20 2 |
Comparative genomics:
Search single species RefSeq proteins at NCBI
Search summary 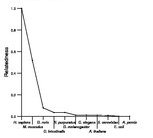
Figure data | ||
Related human proteins:Protein Relative score Description Self-match 1.000 AT-hook transcription factor NACA 0.018 nascent polypeptide-associated complex alpha subuni... FLJ22184 0.015 PREDICTED: hypothetical protein FLJ22184 FLJ22184 0.014 PREDICTED: hypothetical protein LOC80164 FLJ22184 0.013 PREDICTED: hypothetical protein FLJ22184 CASKIN1 0.013 CASK interacting protein 1 MICAL3 0.012 microtubule associated monoxygenase, calponin and L... LMTK3 0.011 lemur tyrosine kinase 3 SETD1A 0.011 SET domain containing 1A ATN1 0.011 atrophin-1 ATN1 0.011 atrophin-1 SCAF1 0.011 SR-related CTD-associated factor 1 PCLO 0.011 piccolo isoform 2 PCLO 0.011 piccolo isoform 1 SRRM1 0.011 serine/arginine repetitive matrix 1 BCL9L 0.010 B-cell CLL/lymphoma 9-like SRRM2 0.010 splicing coactivator subunit SRm300 KDM6B 0.010 lysine (K)-specific demethylase 6B ZNF469 0.010 zinc finger protein 469 WASF2 0.010 WAS protein family, member 2 EIF4G1 0.010 eukaryotic translation initiation factor 4 gamma, 1 ... EIF4G1 0.010 eukaryotic translation initiation factor 4 gamma, 1 ... EIF4G1 0.010 eukaryotic translation initiation factor 4 gamma, 1 ... EIF4G1 0.010 eukaryotic translation initiation factor 4 gamma, 1 ... EIF4G1 0.010 eukaryotic translation initiation factor 4 gamma, 1 ... C1orf62 0.010 hypothetical protein LOC254268 LOC100133756 0.009 PREDICTED: hypothetical protein, partial KIAA1522 0.009 hypothetical protein LOC57648 RERE 0.009 atrophin-1 like protein isoform b RERE 0.009 atrophin-1 like protein isoform aHuman BLASTP results (used to prepare the table) | |||
Gene descriptions are from NCBI RefSeq. Search results were obtained with NCBI BLAST and RefSeq entries. When identical proteins are present, the self-match may not be listed first in BLASTP output. In such cases, the table above has been reordered to place it first.
See About the Figures for the scoring system used in the figure above right. The same scoring system was used in the table of BLASTP results.
Guide to the Human Genome
Copyright © 2010 by Stewart Scherer. All rights reserved.
