
| Name: PSMA2 | Sequence: fasta or formatted (234aa) | NCBI GI: 4506181 | |
|
Description: proteasome subunit alpha type 2
|
Referenced in:
| ||
|
Composition:
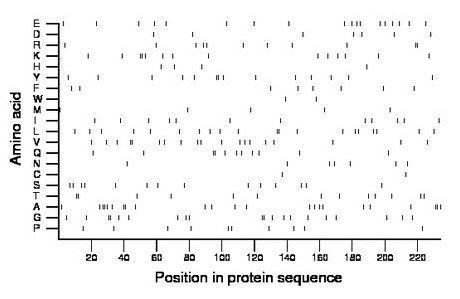
Amino acid Percentage Count Longest homopolymer A alanine 9.8 23 2 C cysteine 0.9 2 1 D aspartate 3.0 7 1 E glutamate 7.7 18 1 F phenylalanine 3.4 8 1 G glycine 8.5 20 2 H histidine 1.7 4 1 I isoleucine 5.1 12 1 K lysine 6.0 14 2 L leucine 8.5 20 2 M methionine 2.1 5 1 N asparagine 3.0 7 1 P proline 4.3 10 1 Q glutamine 4.7 11 2 R arginine 4.7 11 2 S serine 6.0 14 1 T threonine 5.6 13 2 V valine 8.1 19 2 W tryptophan 0.9 2 1 Y tyrosine 6.0 14 2 |
Comparative genomics:
Search single species RefSeq proteins at NCBI
Search summary 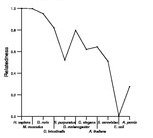
Figure data | ||
Related human proteins:Protein Relative score Description Self-match 1.000 proteasome subunit alpha type 2 PSMA7 0.305 proteasome alpha 7 subunit PSMA8 0.302 proteasome alpha 8 subunit isoform 2 PSMA8 0.287 proteasome alpha 8 subunit isoform 1 PSMA4 0.269 proteasome alpha 4 subunit isoform 1 PSMA4 0.269 proteasome alpha 4 subunit isoform 1 PSMA6 0.246 proteasome alpha 6 subunit PSMA5 0.244 proteasome alpha 5 subunit PSMA1 0.217 proteasome alpha 1 subunit isoform 2 PSMA1 0.214 proteasome alpha 1 subunit isoform 1 PSMA8 0.201 proteasome alpha 8 subunit isoform 3 PSMA3 0.194 proteasome alpha 3 subunit isoform 1 PSMA3 0.192 proteasome alpha 3 subunit isoform 2 PSMA4 0.183 proteasome alpha 4 subunit isoform 2 PSMA1 0.090 proteasome alpha 1 subunit isoform 3 PSMB8 0.056 proteasome beta 8 subunit isoform E2 proprotein [Hom... PSMB8 0.056 proteasome beta 8 subunit isoform E1 proprotein [Homo... PSMB5 0.054 proteasome beta 5 subunit isoform 1 LOC121906 0.052 PREDICTED: similar to hCG30646 LOC121906 0.052 PREDICTED: similar to hCG30646 LOC121906 0.052 PREDICTED: similar to hCG30646 PSMB5 0.038 proteasome beta 5 subunit isoform 2 PSMB10 0.025 proteasome beta 10 subunit proprotein PSMB11 0.020 proteasome beta 11 subunit NEXN 0.014 nexilin (F actin binding protein) HDAC10 0.011 histone deacetylase 10 isoform 2 HDAC10 0.011 histone deacetylase 10 isoform 1 C12orf23 0.011 hypothetical protein LOC90488 USP4 0.011 ubiquitin specific protease 4 isoform a USP4 0.011 ubiquitin specific protease 4 isoform bHuman BLASTP results (used to prepare the table) | |||
Gene descriptions are from NCBI RefSeq. Search results were obtained with NCBI BLAST and RefSeq entries. When identical proteins are present, the self-match may not be listed first in BLASTP output. In such cases, the table above has been reordered to place it first.
See About the Figures for the scoring system used in the figure above right. The same scoring system was used in the table of BLASTP results.
Guide to the Human Genome
Copyright © 2010 by Stewart Scherer. All rights reserved.
