
| Name: PSMA7 | Sequence: fasta or formatted (248aa) | NCBI GI: 4506189 | |
|
Description: proteasome alpha 7 subunit
|
Referenced in:
| ||
|
Composition:
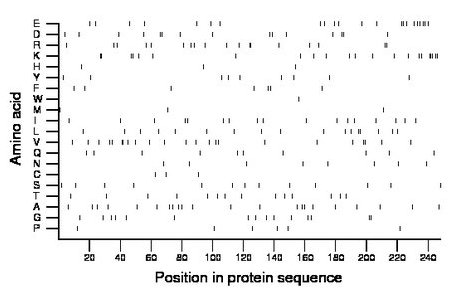
Amino acid Percentage Count Longest homopolymer A alanine 8.9 22 1 C cysteine 1.2 3 1 D aspartate 6.0 15 2 E glutamate 8.9 22 2 F phenylalanine 2.8 7 1 G glycine 6.0 15 2 H histidine 1.2 3 1 I isoleucine 6.9 17 1 K lysine 8.9 22 3 L leucine 6.9 17 2 M methionine 1.2 3 1 N asparagine 3.2 8 1 P proline 2.4 6 1 Q glutamine 4.0 10 1 R arginine 7.3 18 2 S serine 5.2 13 1 T threonine 5.6 14 1 V valine 9.3 23 2 W tryptophan 0.4 1 1 Y tyrosine 3.6 9 1 |
Comparative genomics:
Search single species RefSeq proteins at NCBI
Search summary 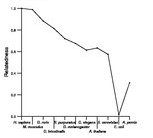
Figure data | ||
Related human proteins:Protein Relative score Description Self-match 1.000 proteasome alpha 7 subunit PSMA8 0.848 proteasome alpha 8 subunit isoform 2 PSMA8 0.833 proteasome alpha 8 subunit isoform 1 PSMA8 0.662 proteasome alpha 8 subunit isoform 3 PSMA4 0.297 proteasome alpha 4 subunit isoform 1 PSMA4 0.297 proteasome alpha 4 subunit isoform 1 PSMA2 0.293 proteasome subunit alpha type 2 PSMA5 0.275 proteasome alpha 5 subunit PSMA1 0.245 proteasome alpha 1 subunit isoform 2 PSMA1 0.245 proteasome alpha 1 subunit isoform 1 PSMA6 0.232 proteasome alpha 6 subunit PSMA3 0.217 proteasome alpha 3 subunit isoform 1 PSMA3 0.204 proteasome alpha 3 subunit isoform 2 PSMA4 0.187 proteasome alpha 4 subunit isoform 2 PSMA1 0.124 proteasome alpha 1 subunit isoform 3 PSMB10 0.065 proteasome beta 10 subunit proprotein LOC121906 0.063 PREDICTED: similar to hCG30646 LOC121906 0.063 PREDICTED: similar to hCG30646 LOC121906 0.063 PREDICTED: similar to hCG30646 PSMB5 0.039 proteasome beta 5 subunit isoform 1 PSMB7 0.037 proteasome beta 7 subunit proprotein PSMB9 0.028 proteasome beta 9 subunit isoform 2 proprotein [Homo... PSMB9 0.028 proteasome beta 9 subunit isoform 1 proprotein ZNF611 0.015 zinc finger protein 611 isoform a ZNF611 0.015 zinc finger protein 611 isoform a ZNF611 0.015 zinc finger protein 611 isoform a HSPA5 0.015 heat shock 70kDa protein 5 ERCC5 0.015 XPG-complementing protein PARD3 0.015 partitioning-defective protein 3 homolog PSMB1 0.013 proteasome beta 1 subunitHuman BLASTP results (used to prepare the table) | |||
Gene descriptions are from NCBI RefSeq. Search results were obtained with NCBI BLAST and RefSeq entries. When identical proteins are present, the self-match may not be listed first in BLASTP output. In such cases, the table above has been reordered to place it first.
See About the Figures for the scoring system used in the figure above right. The same scoring system was used in the table of BLASTP results.
Guide to the Human Genome
Copyright © 2010 by Stewart Scherer. All rights reserved.
