
| Name: NEXN | Sequence: fasta or formatted (675aa) | NCBI GI: 148839339 | |
|
Description: nexilin (F actin binding protein)
|
Referenced in:
| ||
|
Composition:
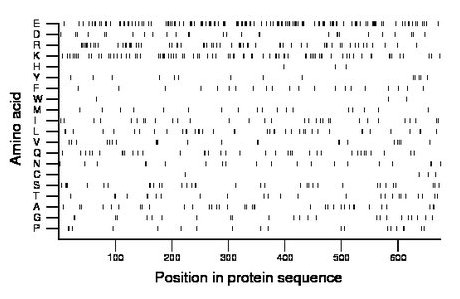
Amino acid Percentage Count Longest homopolymer A alanine 5.5 37 2 C cysteine 0.6 4 1 D aspartate 4.6 31 3 E glutamate 20.6 139 7 F phenylalanine 3.1 21 1 G glycine 3.7 25 2 H histidine 0.4 3 1 I isoleucine 4.6 31 1 K lysine 12.0 81 2 L leucine 5.9 40 2 M methionine 2.8 19 1 N asparagine 3.0 20 2 P proline 2.8 19 1 Q glutamine 5.3 36 1 R arginine 10.1 68 3 S serine 5.2 35 3 T threonine 3.7 25 1 V valine 3.4 23 2 W tryptophan 0.6 4 2 Y tyrosine 2.1 14 1 |
Comparative genomics:
Search single species RefSeq proteins at NCBI
Search summary 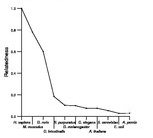
Figure data | ||
Related human proteins:Protein Relative score Description Self-match 1.000 nexilin (F actin binding protein) TCHH 0.097 trichohyalin CALD1 0.082 caldesmon 1 isoform 1 LOC727832 0.075 golgi autoantigen, golgin subfamily a-like LOC283685 0.072 PREDICTED: golgi autoantigen, golgin subfamily a-li... LOC283685 0.072 PREDICTED: golgi autoantigen, golgin subfamily a-li... LOC440243 0.060 PREDICTED: Putative golgin subfamily A member 6-lik... PLEC1 0.060 plectin 1 isoform 11 PLEC1 0.060 plectin 1 isoform 10 PLEC1 0.060 plectin 1 isoform 8 PLEC1 0.060 plectin 1 isoform 7 PLEC1 0.060 plectin 1 isoform 6 PLEC1 0.060 plectin 1 isoform 3 PLEC1 0.060 plectin 1 isoform 2 PLEC1 0.060 plectin 1 isoform 1 LOC283767 0.059 golgi autoantigen, golgin subfamily a-like MYH10 0.058 myosin, heavy polypeptide 10, non-muscle MYH11 0.056 smooth muscle myosin heavy chain 11 isoform SM1A [Ho... MYH11 0.056 smooth muscle myosin heavy chain 11 isoform SM1B [Ho... MYH11 0.056 smooth muscle myosin heavy chain 11 isoform SM2B [Ho... MYH11 0.056 smooth muscle myosin heavy chain 11 isoform SM2A [Ho... LOC100286959 0.056 PREDICTED: hypothetical protein XP_002343921 MYH9 0.055 myosin, heavy polypeptide 9, non-muscle WDR87 0.054 NYD-SP11 protein LOC100133758 0.054 PREDICTED: hypothetical protein, partial LOC645202 0.052 PREDICTED: hypothetical protein LOC645202 CALD1 0.052 caldesmon 1 isoform 4 CALD1 0.052 caldesmon 1 isoform 3 ANKRD12 0.051 ankyrin repeat domain 12 isoform 2 ANKRD12 0.051 ankyrin repeat domain 12 isoform 1Human BLASTP results (used to prepare the table) | |||
Gene descriptions are from NCBI RefSeq. Search results were obtained with NCBI BLAST and RefSeq entries. When identical proteins are present, the self-match may not be listed first in BLASTP output. In such cases, the table above has been reordered to place it first.
See About the Figures for the scoring system used in the figure above right. The same scoring system was used in the table of BLASTP results.
Guide to the Human Genome
Copyright © 2010 by Stewart Scherer. All rights reserved.
