
| Name: GATA3 | Sequence: fasta or formatted (443aa) | NCBI GI: 4503929 | |
|
Description: GATA binding protein 3 isoform 2
|
Referenced in: Hematopoiesis and Erythrocytes
| ||
Other entries for this name:
alt prot [444aa] GATA binding protein 3 isoform 1 | |||
|
Composition:
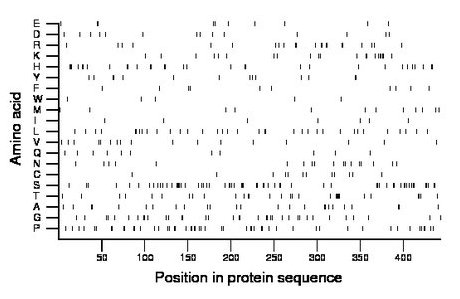
Amino acid Percentage Count Longest homopolymer A alanine 5.6 25 2 C cysteine 2.7 12 1 D aspartate 3.2 14 1 E glutamate 2.3 10 2 F phenylalanine 2.3 10 1 G glycine 8.1 36 2 H histidine 7.0 31 3 I isoleucine 1.6 7 1 K lysine 4.7 21 2 L leucine 7.9 35 2 M methionine 2.7 12 1 N asparagine 4.1 18 1 P proline 11.5 51 2 Q glutamine 2.5 11 1 R arginine 5.0 22 2 S serine 14.0 62 4 T threonine 6.8 30 5 V valine 3.8 17 1 W tryptophan 1.1 5 1 Y tyrosine 3.2 14 2 |
Comparative genomics:
Search single species RefSeq proteins at NCBI
Search summary 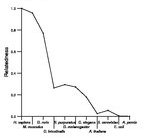
Figure data | ||
Related human proteins:Protein Relative score Description Self-match 1.000 GATA binding protein 3 isoform 2 GATA3 0.995 GATA binding protein 3 isoform 1 GATA2 0.587 GATA binding protein 2 isoform 1 GATA2 0.587 GATA binding protein 2 isoform 1 GATA2 0.548 GATA binding protein 2 isoform 2 GATA1 0.225 GATA binding protein 1 GATA4 0.205 GATA binding protein 4 GATA5 0.198 GATA binding protein 5 GATA6 0.192 GATA binding protein 6 TRPS1 0.055 zinc finger transcription factor TRPS1 MUC6 0.035 mucin 6, gastric ATN1 0.023 atrophin-1 ATN1 0.023 atrophin-1 GLP-1 0.023 GATA like protein-1 LOC100133761 0.022 PREDICTED: similar to Mucin-6, partial MUC12 0.017 PREDICTED: mucin 12 MUC12 0.017 PREDICTED: mucin 12, cell surface associated MUC12 0.016 PREDICTED: mucin 12 LOC728503 0.014 PREDICTED: hypothetical protein LOC100133756 0.014 PREDICTED: hypothetical protein, partial LOC728503 0.014 PREDICTED: hypothetical protein LOC728503 0.014 PREDICTED: hypothetical protein MUC4 0.014 mucin 4 isoform a PRRT1 0.013 NG5 protein SSBP3 0.013 single stranded DNA binding protein 3 isoform a [Hom... FLJ10404 0.013 hypothetical protein LOC54540 UNCX 0.013 UNC homeobox FOXO4 0.013 forkhead box O4 LOC100293557 0.013 PREDICTED: hypothetical protein MLL5 0.013 myeloid/lymphoid or mixed-lineage leukemia 5Human BLASTP results (used to prepare the table) | |||
Gene descriptions are from NCBI RefSeq. Search results were obtained with NCBI BLAST and RefSeq entries. When identical proteins are present, the self-match may not be listed first in BLASTP output. In such cases, the table above has been reordered to place it first.
See About the Figures for the scoring system used in the figure above right. The same scoring system was used in the table of BLASTP results.
Guide to the Human Genome
Copyright © 2010 by Stewart Scherer. All rights reserved.
