
| Name: TMEM165 | Sequence: fasta or formatted (324aa) | NCBI GI: 32189371 | |
|
Description: transmembrane protein 165
| Not currently referenced in the text | ||
|
Composition:
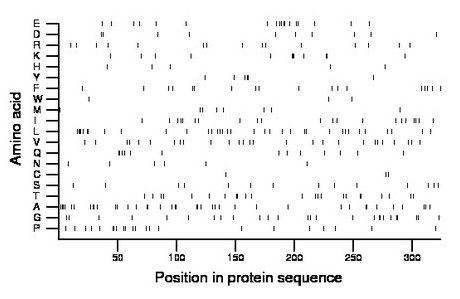
Amino acid Percentage Count Longest homopolymer A alanine 12.0 39 4 C cysteine 0.9 3 1 D aspartate 3.1 10 1 E glutamate 5.6 18 2 F phenylalanine 5.6 18 2 G glycine 8.0 26 2 H histidine 1.5 5 1 I isoleucine 6.5 21 2 K lysine 3.7 12 3 L leucine 10.8 35 4 M methionine 2.5 8 1 N asparagine 1.9 6 1 P proline 6.8 22 2 Q glutamine 4.0 13 2 R arginine 4.6 15 1 S serine 4.3 14 1 T threonine 7.1 23 2 V valine 8.3 27 1 W tryptophan 0.9 3 1 Y tyrosine 1.9 6 2 |
Comparative genomics:
Search single species RefSeq proteins at NCBI
Search summary 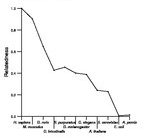
Figure data | ||
Related human proteins:Protein Relative score Description Self-match 1.000 transmembrane protein 165 SEPT9 0.013 septin 9 isoform b SEPT9 0.013 septin 9 isoform a SEPT9 0.013 septin 9 isoform c NCOR2 0.011 nuclear receptor co-repressor 2 isoform 2 NCOR2 0.011 nuclear receptor co-repressor 2 isoform 1 PPRC1 0.011 peroxisome proliferator-activated receptor gamma, co... GLT8D4 0.011 glycosyltransferase 8 domain containing 4 C10orf134 0.010 PREDICTED: chromosome 10 open reading frame 134 [Ho... C10orf134 0.010 PREDICTED: chromosome 10 open reading frame 134 [Ho... C10orf134 0.010 PREDICTED: chromosome 10 open reading frame 134 [Ho... HELZ 0.010 helicase with zinc finger domain SFPQ 0.010 splicing factor proline/glutamine rich (polypyrimidin... SEPT9 0.008 septin 9 isoform e SEPT9 0.008 septin 9 isoform e PLCXD1 0.008 phosphatidylinositol-specific phospholipase C, X doma... STIM2 0.008 stromal interaction molecule 2 RHOT2 0.008 ras homolog gene family, member T2 CREG1 0.008 cellular repressor of E1A-stimulated genes SAMD1 0.008 sterile alpha motif domain containing 1 PRG4 0.008 proteoglycan 4 isoform D PRG4 0.008 proteoglycan 4 isoform C PRG4 0.008 proteoglycan 4 isoform B PRG4 0.008 proteoglycan 4 isoform A KLF5 0.008 Kruppel-like factor 5 C2orf55 0.008 hypothetical protein LOC343990 CCDC59 0.008 coiled-coil domain containing 59 GNAS 0.007 GNAS complex locus alex LOC100292723 0.007 PREDICTED: hypothetical protein GOLGA4 0.007 golgi autoantigen, golgin subfamily a, 4Human BLASTP results (used to prepare the table) | |||
Gene descriptions are from NCBI RefSeq. Search results were obtained with NCBI BLAST and RefSeq entries. When identical proteins are present, the self-match may not be listed first in BLASTP output. In such cases, the table above has been reordered to place it first.
See About the Figures for the scoring system used in the figure above right. The same scoring system was used in the table of BLASTP results.
Guide to the Human Genome
Copyright © 2010 by Stewart Scherer. All rights reserved.
