
| Name: LIMK1 | Sequence: fasta or formatted (647aa) | NCBI GI: 4505001 | |
|
Description: LIM domain kinase 1
|
Referenced in:
| ||
|
Composition:
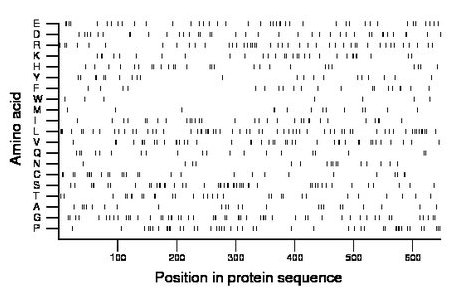
Amino acid Percentage Count Longest homopolymer A alanine 3.6 23 1 C cysteine 4.3 28 2 D aspartate 5.9 38 1 E glutamate 6.5 42 2 F phenylalanine 3.1 20 2 G glycine 8.5 55 2 H histidine 4.2 27 1 I isoleucine 4.9 32 2 K lysine 4.6 30 2 L leucine 9.6 62 2 M methionine 2.3 15 1 N asparagine 2.5 16 1 P proline 7.0 45 2 Q glutamine 3.1 20 1 R arginine 6.8 44 2 S serine 7.3 47 2 T threonine 4.8 31 1 V valine 6.6 43 3 W tryptophan 1.1 7 1 Y tyrosine 3.4 22 2 |
Comparative genomics:
Search single species RefSeq proteins at NCBI
Search summary 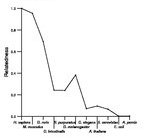
Figure data | ||
Related human proteins:Protein Relative score Description Self-match 1.000 LIM domain kinase 1 LIMK2 0.484 LIM domain kinase 2 isoform 2a LIMK2 0.470 LIM domain kinase 2 isoform 2b LIMK2 0.455 LIM domain kinase 2 isoform 1 TESK2 0.152 testis-specific protein kinase 2 TESK1 0.150 testis-specific protein kinase 1 FER 0.085 fer (fps/fes related) tyrosine kinase EPHA3 0.079 ephrin receptor EphA3 isoform a precursor EPHB1 0.078 ephrin receptor EphB1 precursor EPHA5 0.076 ephrin receptor EphA5 isoform b precursor EPHA5 0.076 ephrin receptor EphA5 isoform a precursor SRC 0.075 proto-oncogene tyrosine-protein kinase SRC SRC 0.075 proto-oncogene tyrosine-protein kinase SRC FRK 0.075 fyn-related kinase EPHB2 0.075 ephrin receptor EphB2 isoform 1 precursor EPHB2 0.075 ephrin receptor EphB2 isoform 2 precursor EPHB3 0.074 ephrin receptor EphB3 precursor FGR 0.074 proto-oncogene tyrosine-protein kinase FGR FGR 0.074 proto-oncogene tyrosine-protein kinase FGR FGR 0.074 proto-oncogene tyrosine-protein kinase FGR HCK 0.072 hemopoietic cell kinase isoform p61HCK FES 0.072 feline sarcoma oncogene isoform 4 FES 0.072 feline sarcoma oncogene isoform 3 FES 0.071 feline sarcoma oncogene isoform 2 FES 0.071 feline sarcoma oncogene isoform 1 EPHA2 0.070 ephrin receptor EphA2 RET 0.070 ret proto-oncogene isoform c RET 0.070 ret proto-oncogene isoform a PAK2 0.070 p21-activated kinase 2 EPHB4 0.070 EPH receptor B4 precursorHuman BLASTP results (used to prepare the table) | |||
Gene descriptions are from NCBI RefSeq. Search results were obtained with NCBI BLAST and RefSeq entries. When identical proteins are present, the self-match may not be listed first in BLASTP output. In such cases, the table above has been reordered to place it first.
See About the Figures for the scoring system used in the figure above right. The same scoring system was used in the table of BLASTP results.
Guide to the Human Genome
Copyright © 2010 by Stewart Scherer. All rights reserved.
