
| Name: TBC1D23 | Sequence: fasta or formatted (684aa) | NCBI GI: 217035118 | |
|
Description: TBC1 domain family, member 23
|
Referenced in:
| ||
|
Composition:
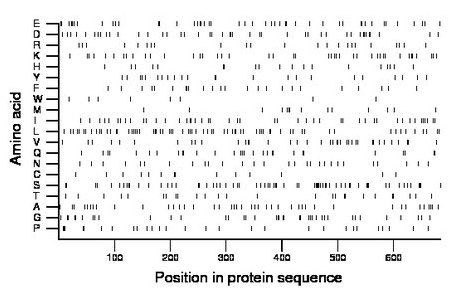
Amino acid Percentage Count Longest homopolymer A alanine 6.3 43 2 C cysteine 2.0 14 1 D aspartate 6.6 45 3 E glutamate 7.2 49 3 F phenylalanine 3.7 25 2 G glycine 5.7 39 2 H histidine 2.9 20 2 I isoleucine 6.9 47 2 K lysine 6.4 44 3 L leucine 10.4 71 3 M methionine 2.2 15 1 N asparagine 4.1 28 1 P proline 4.1 28 2 Q glutamine 4.2 29 2 R arginine 3.4 23 1 S serine 10.1 69 3 T threonine 3.8 26 1 V valine 5.6 38 2 W tryptophan 1.2 8 1 Y tyrosine 3.4 23 2 |
Comparative genomics:
Search single species RefSeq proteins at NCBI
Search summary 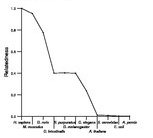
Figure data | ||
Related human proteins:Protein Relative score Description Self-match 1.000 TBC1 domain family, member 23 TBC1D4 0.022 TBC1 domain family, member 4 TBC1D2B 0.018 TBC1 domain family, member 2B isoform a TBC1D2B 0.018 TBC1 domain family, member 2B isoform b TBC1D12 0.016 TBC1 domain family, member 12 TBC1D14 0.014 TBC1 domain family, member 14 isoform b TBC1D14 0.014 TBC1 domain family, member 14 isoform a TBC1D14 0.014 TBC1 domain family, member 14 isoform a TBCKL 0.013 TBC domain-containing protein kinase-like EVI5 0.010 ecotropic viral integration site 5 TBC1D22A 0.009 TBC1 domain family, member 22A EVI5L 0.007 ecotropic viral integration site 5-like isoform 1 [... EVI5L 0.007 ecotropic viral integration site 5-like isoform 2 [H... TBC1D17 0.007 TBC1 domain family, member 17 TBC1D7 0.007 TBC1 domain family, member 7 isoform a TBC1D7 0.007 TBC1 domain family, member 7 isoform a TBC1D7 0.007 TBC1 domain family, member 7 isoform a USP6NL 0.007 USP6 N-terminal like isoform 1 USP6NL 0.007 USP6 N-terminal like isoform 2 DUSP6 0.007 dual specificity phosphatase 6 isoform a TBC1D19 0.006 TBC1 domain family, member 19 TBC1D10A 0.006 TBC1 domain family, member 10A SDK1 0.006 sidekick 1 GREB1 0.006 GREB1 protein isoform a SGSM3 0.006 small G protein signaling modulator 3 TBC1D10B 0.006 TBC1 domain family, member 10B CDC25C 0.005 cell division cycle 25C isoform a CDC25C 0.005 cell division cycle 25C isoform b CTTNBP2 0.005 cortactin binding protein 2 TBC1D5 0.004 TBC1 domain family, member 5 isoform aHuman BLASTP results (used to prepare the table) | |||
Gene descriptions are from NCBI RefSeq. Search results were obtained with NCBI BLAST and RefSeq entries. When identical proteins are present, the self-match may not be listed first in BLASTP output. In such cases, the table above has been reordered to place it first.
See About the Figures for the scoring system used in the figure above right. The same scoring system was used in the table of BLASTP results.
Guide to the Human Genome
Copyright © 2010 by Stewart Scherer. All rights reserved.
