
| Name: SDK1 | Sequence: fasta or formatted (2213aa) | NCBI GI: 119220552 | |
|
Description: sidekick 1
|
Referenced in:
| ||
|
Composition:
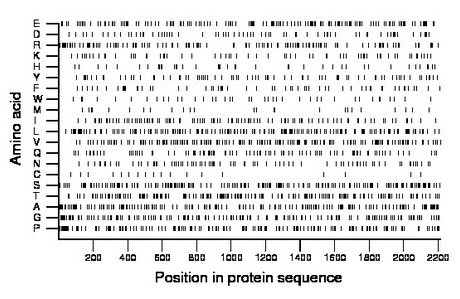
Amino acid Percentage Count Longest homopolymer A alanine 8.1 180 3 C cysteine 0.8 18 1 D aspartate 3.4 75 2 E glutamate 6.7 149 3 F phenylalanine 2.6 58 2 G glycine 7.5 166 6 H histidine 1.9 41 2 I isoleucine 4.7 105 2 K lysine 3.1 69 2 L leucine 8.1 179 2 M methionine 1.2 26 1 N asparagine 3.7 82 2 P proline 7.9 175 4 Q glutamine 4.2 93 2 R arginine 5.9 130 2 S serine 8.8 194 3 T threonine 8.0 178 3 V valine 7.8 172 2 W tryptophan 1.9 42 2 Y tyrosine 3.7 81 2 |
Comparative genomics:
Search single species RefSeq proteins at NCBI
Search summary 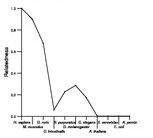
Figure data | ||
Related human proteins:Protein Relative score Description Self-match 1.000 sidekick 1 SDK2 0.583 sidekick 2 LOC100134174 0.065 PREDICTED: similar to sidekick homolog 2 (chicken) ... DSCAM 0.065 Down syndrome cell adhesion molecule isoform CHD2-42... CNTN3 0.062 contactin 3 CNTN2 0.061 contactin 2 precursor PTPRD 0.060 protein tyrosine phosphatase, receptor type, D isofo... CNTN6 0.060 contactin 6 PTPRD 0.060 protein tyrosine phosphatase, receptor type, D isofo... DSCAML1 0.059 Down syndrome cell adhesion molecule like 1 CHL1 0.058 cell adhesion molecule with homology to L1CAM precur... PTPRD 0.058 protein tyrosine phosphatase, receptor type, D isofor... CNTN1 0.058 contactin 1 isoform 2 precursor CNTN1 0.058 contactin 1 isoform 1 precursor CNTN5 0.056 contactin 5 isoform long CNTN5 0.056 contactin 5 isoform short NRCAM 0.056 neuronal cell adhesion molecule isoform A precursor ... CNTN4 0.054 contactin 4 isoform a precursor DCC 0.054 deleted in colorectal carcinoma NFASC 0.054 neurofascin isoform 3 precursor NFASC 0.054 neurofascin isoform 4 precursor NRCAM 0.053 neuronal cell adhesion molecule isoform B precursor ... L1CAM 0.053 L1 cell adhesion molecule isoform 3 precursor [Homo... L1CAM 0.053 L1 cell adhesion molecule isoform 2 precursor L1CAM 0.053 L1 cell adhesion molecule isoform 1 precursor NFASC 0.052 neurofascin isoform 2 precursor PTPRS 0.051 protein tyrosine phosphatase, receptor type, sigma ... PTPRF 0.050 protein tyrosine phosphatase, receptor type, F isof... PTPRF 0.049 protein tyrosine phosphatase, receptor type, F isof... PTPRQ 0.048 protein tyrosine phosphatase, receptor type, Q [Hom...Human BLASTP results (used to prepare the table) | |||
Gene descriptions are from NCBI RefSeq. Search results were obtained with NCBI BLAST and RefSeq entries. When identical proteins are present, the self-match may not be listed first in BLASTP output. In such cases, the table above has been reordered to place it first.
See About the Figures for the scoring system used in the figure above right. The same scoring system was used in the table of BLASTP results.
Guide to the Human Genome
Copyright © 2010 by Stewart Scherer. All rights reserved.
