
| Name: ATRN | Sequence: fasta or formatted (1429aa) | NCBI GI: 21450861 | |
|
Description: attractin isoform 1
|
Referenced in:
| ||
Other entries for this name:
alt prot [1272aa] attractin isoform 2 | |||
|
Composition:
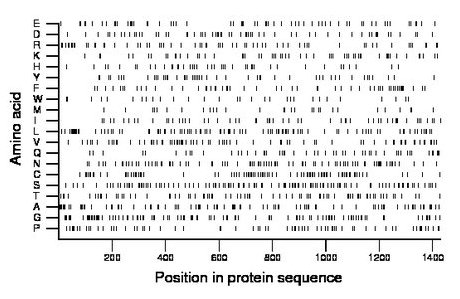
Amino acid Percentage Count Longest homopolymer A alanine 7.1 102 7 C cysteine 6.2 88 1 D aspartate 4.5 65 2 E glutamate 4.5 65 2 F phenylalanine 4.1 59 2 G glycine 7.3 105 2 H histidine 2.9 42 2 I isoleucine 3.8 54 1 K lysine 4.3 62 2 L leucine 7.8 112 8 M methionine 2.1 30 1 N asparagine 6.1 87 2 P proline 5.2 75 3 Q glutamine 3.6 52 2 R arginine 4.8 68 3 S serine 8.4 120 2 T threonine 5.5 79 2 V valine 5.7 81 3 W tryptophan 2.2 31 1 Y tyrosine 3.6 52 2 |
Comparative genomics:
Search single species RefSeq proteins at NCBI
Search summary 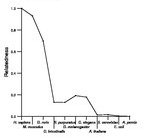
Figure data | ||
Related human proteins:Protein Relative score Description Self-match 1.000 attractin isoform 1 ATRN 0.895 attractin isoform 2 ATRNL1 0.577 attractin-like 1 MEGF8 0.062 multiple EGF-like-domains 8 LAMA1 0.018 laminin, alpha 1 precursor LAMA2 0.017 laminin alpha 2 subunit isoform b precursor LAMA2 0.017 laminin alpha 2 subunit isoform a precursor BMP1 0.017 bone morphogenetic protein 1 isoform 3 precursor [Hom... LAMB2 0.016 laminin, beta 2 precursor LAMA3 0.016 laminin alpha 3 subunit isoform 1 LAMA3 0.016 laminin alpha 3 subunit isoform 4 LAMA3 0.016 laminin alpha 3 subunit isoform 3 LAMA3 0.016 laminin alpha 3 subunit isoform 2 LAMC1 0.016 laminin, gamma 1 precursor LAMB4 0.016 laminin, beta 4 TLL1 0.016 tolloid-like 1 TLL2 0.015 tolloid-like 2 CSMD2 0.015 CUB and Sushi multiple domains 2 USH2A 0.015 usherin isoform B USH2A 0.015 usherin isoform A MEGF11 0.015 multiple EGF-like-domains 11 CSMD3 0.014 CUB and Sushi multiple domains 3 isoform 2 CSMD3 0.014 CUB and Sushi multiple domains 3 isoform 3 CSMD3 0.014 CUB and Sushi multiple domains 3 isoform 1 KLHDC3 0.014 kelch domain containing 3 NTNG1 0.014 netrin G1 isoform 1 LAMC3 0.014 laminin, gamma 3 precursor CUBN 0.014 cubilin PAMR1 0.014 regeneration associated muscle protease isoform b [H... HSPG2 0.013 heparan sulfate proteoglycan 2Human BLASTP results (used to prepare the table) | |||
Gene descriptions are from NCBI RefSeq. Search results were obtained with NCBI BLAST and RefSeq entries. When identical proteins are present, the self-match may not be listed first in BLASTP output. In such cases, the table above has been reordered to place it first.
See About the Figures for the scoring system used in the figure above right. The same scoring system was used in the table of BLASTP results.
Guide to the Human Genome
Copyright © 2010 by Stewart Scherer. All rights reserved.
