
| Name: PLCD3 | Sequence: fasta or formatted (789aa) | NCBI GI: 19115964 | |
|
Description: phospholipase C delta 3
|
Referenced in: Inositol Pathways
| ||
|
Composition:
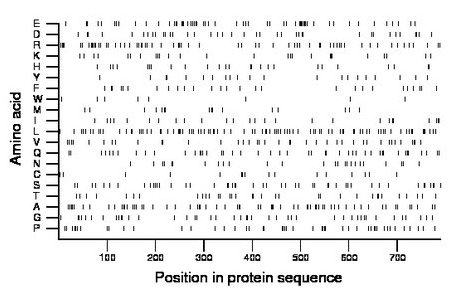
Amino acid Percentage Count Longest homopolymer A alanine 8.7 69 3 C cysteine 2.0 16 1 D aspartate 4.8 38 2 E glutamate 8.1 64 6 F phenylalanine 3.4 27 2 G glycine 5.7 45 2 H histidine 3.2 25 1 I isoleucine 3.3 26 1 K lysine 3.5 28 2 L leucine 11.5 91 2 M methionine 2.2 17 2 N asparagine 3.3 26 2 P proline 6.5 51 2 Q glutamine 5.8 46 2 R arginine 8.6 68 2 S serine 6.2 49 3 T threonine 4.3 34 2 V valine 5.1 40 2 W tryptophan 1.0 8 1 Y tyrosine 2.7 21 1 |
Comparative genomics:
Search single species RefSeq proteins at NCBI
Search summary 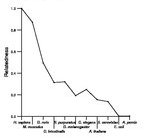
Figure data | ||
Related human proteins:Protein Relative score Description Self-match 1.000 phospholipase C delta 3 PLCD1 0.467 phospholipase C, delta 1 isoform 1 PLCD1 0.466 phospholipase C, delta 1 isoform 2 PLCD4 0.437 phospholipase C, delta 4 PLCL2 0.271 phospholipase C-like 2 isoform 1 PLCL2 0.271 phospholipase C-like 2 isoform 2 PLCZ1 0.261 phospholipase C, zeta 1 PLCL1 0.252 phospholipase C-like 1 isoform a PLCL1 0.252 phospholipase C-like 1 isoform b PLCB4 0.214 phospholipase C beta 4 isoform a PLCB4 0.214 phospholipase C beta 4 isoform b PLCB2 0.196 phospholipase C, beta 2 PLCB1 0.179 phosphoinositide-specific phospholipase C beta 1 iso... PLCB1 0.179 phosphoinositide-specific phospholipase C beta 1 iso... PLCH2 0.178 phospholipase C, eta 2 PLCH1 0.172 phospholipase C eta 1 isoform c PLCH1 0.172 phospholipase C eta 1 isoform a PLCH1 0.172 phospholipase C eta 1 isoform b PLCG1 0.130 phospholipase C, gamma 1 isoform a PLCG1 0.130 phospholipase C, gamma 1 isoform b PLCG2 0.130 phospholipase C, gamma 2 PLCB3 0.102 phospholipase C beta 3 PLCE1 0.100 phospholipase C, epsilon 1 PRKCB 0.015 protein kinase C, beta isoform 1 PRKCB 0.015 protein kinase C, beta isoform 2 SYT7 0.013 synaptotagmin VII PRKCA 0.012 protein kinase C, alpha PRKCG 0.012 protein kinase C, gamma MYOF 0.011 myoferlin isoform a SENP3 0.011 SUMO1/sentrin/SMT3 specific protease 3Human BLASTP results (used to prepare the table) | |||
Gene descriptions are from NCBI RefSeq. Search results were obtained with NCBI BLAST and RefSeq entries. When identical proteins are present, the self-match may not be listed first in BLASTP output. In such cases, the table above has been reordered to place it first.
See About the Figures for the scoring system used in the figure above right. The same scoring system was used in the table of BLASTP results.
Guide to the Human Genome
Copyright © 2010 by Stewart Scherer. All rights reserved.
