
| Name: PLCB2 | Sequence: fasta or formatted (1185aa) | NCBI GI: 95147333 | |
|
Description: phospholipase C, beta 2
|
Referenced in: Inositol Pathways
| ||
|
Composition:
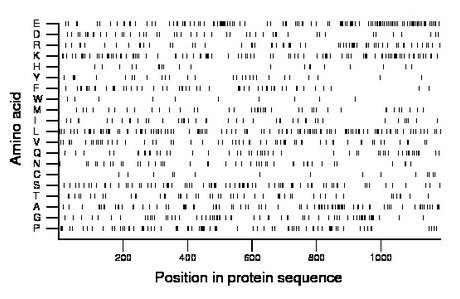
Amino acid Percentage Count Longest homopolymer A alanine 7.3 87 2 C cysteine 1.4 17 1 D aspartate 4.1 48 2 E glutamate 10.6 126 7 F phenylalanine 4.5 53 2 G glycine 5.6 66 2 H histidine 1.8 21 2 I isoleucine 3.8 45 2 K lysine 8.0 95 3 L leucine 9.6 114 3 M methionine 3.5 41 2 N asparagine 3.6 43 2 P proline 6.4 76 2 Q glutamine 4.4 52 2 R arginine 5.4 64 2 S serine 6.9 82 3 T threonine 4.4 52 2 V valine 5.4 64 3 W tryptophan 0.8 10 1 Y tyrosine 2.4 29 2 |
Comparative genomics:
Search single species RefSeq proteins at NCBI
Search summary 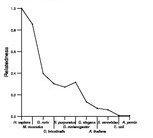
Figure data | ||
Related human proteins:Protein Relative score Description Self-match 1.000 phospholipase C, beta 2 PLCB1 0.448 phosphoinositide-specific phospholipase C beta 1 iso... PLCB1 0.442 phosphoinositide-specific phospholipase C beta 1 iso... PLCB3 0.418 phospholipase C beta 3 PLCB4 0.283 phospholipase C beta 4 isoform a PLCB4 0.283 phospholipase C beta 4 isoform b PLCD4 0.133 phospholipase C, delta 4 PLCD3 0.131 phospholipase C delta 3 PLCD1 0.127 phospholipase C, delta 1 isoform 2 PLCD1 0.127 phospholipase C, delta 1 isoform 1 PLCL2 0.119 phospholipase C-like 2 isoform 1 PLCL2 0.119 phospholipase C-like 2 isoform 2 PLCZ1 0.116 phospholipase C, zeta 1 PLCH2 0.110 phospholipase C, eta 2 PLCL1 0.108 phospholipase C-like 1 isoform a PLCL1 0.108 phospholipase C-like 1 isoform b PLCE1 0.065 phospholipase C, epsilon 1 PLCH1 0.061 phospholipase C eta 1 isoform c PLCH1 0.061 phospholipase C eta 1 isoform a PLCH1 0.061 phospholipase C eta 1 isoform b PLCG1 0.055 phospholipase C, gamma 1 isoform a PLCG1 0.055 phospholipase C, gamma 1 isoform b PLCG2 0.053 phospholipase C, gamma 2 TCHH 0.016 trichohyalin LOC645202 0.016 PREDICTED: hypothetical protein LOC645202 DCTN1 0.014 dynactin 1 isoform 1 LOC100133220 0.014 PREDICTED: hypothetical protein GOLGA4 0.014 golgi autoantigen, golgin subfamily a, 4 DCTN1 0.013 dynactin 1 isoform 4 DCTN1 0.013 dynactin 1 isoform 3Human BLASTP results (used to prepare the table) | |||
Gene descriptions are from NCBI RefSeq. Search results were obtained with NCBI BLAST and RefSeq entries. When identical proteins are present, the self-match may not be listed first in BLASTP output. In such cases, the table above has been reordered to place it first.
See About the Figures for the scoring system used in the figure above right. The same scoring system was used in the table of BLASTP results.
Guide to the Human Genome
Copyright © 2010 by Stewart Scherer. All rights reserved.
