
| Name: PLCH2 | Sequence: fasta or formatted (1416aa) | NCBI GI: 78499633 | |
|
Description: phospholipase C, eta 2
|
Referenced in: Calmodulin and Calcium
| ||
|
Composition:
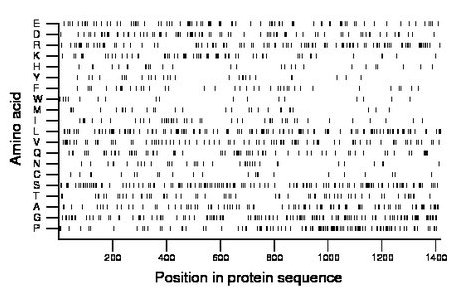
Amino acid Percentage Count Longest homopolymer A alanine 6.7 95 3 C cysteine 1.7 24 2 D aspartate 5.9 83 3 E glutamate 6.1 86 3 F phenylalanine 2.7 38 1 G glycine 9.1 129 2 H histidine 2.1 30 3 I isoleucine 3.3 47 2 K lysine 4.7 67 3 L leucine 8.8 125 2 M methionine 2.1 30 2 N asparagine 2.6 37 2 P proline 8.1 114 4 Q glutamine 5.0 71 3 R arginine 7.5 106 2 S serine 10.2 144 5 T threonine 4.2 60 2 V valine 6.0 85 2 W tryptophan 1.2 17 1 Y tyrosine 2.0 28 2 |
Comparative genomics:
Search single species RefSeq proteins at NCBI
Search summary 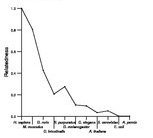
Figure data | ||
Related human proteins:Protein Relative score Description Self-match 1.000 phospholipase C, eta 2 PLCH1 0.418 phospholipase C eta 1 isoform b PLCH1 0.417 phospholipase C eta 1 isoform c PLCH1 0.417 phospholipase C eta 1 isoform a PLCL2 0.125 phospholipase C-like 2 isoform 1 PLCL2 0.125 phospholipase C-like 2 isoform 2 PLCL1 0.114 phospholipase C-like 1 isoform a PLCL1 0.114 phospholipase C-like 1 isoform b PLCB4 0.113 phospholipase C beta 4 isoform a PLCB4 0.113 phospholipase C beta 4 isoform b PLCD4 0.112 phospholipase C, delta 4 PLCB1 0.103 phosphoinositide-specific phospholipase C beta 1 iso... PLCB1 0.103 phosphoinositide-specific phospholipase C beta 1 iso... PLCB3 0.101 phospholipase C beta 3 PLCD3 0.098 phospholipase C delta 3 PLCD1 0.098 phospholipase C, delta 1 isoform 1 PLCD1 0.098 phospholipase C, delta 1 isoform 2 PLCE1 0.096 phospholipase C, epsilon 1 PLCB2 0.091 phospholipase C, beta 2 PLCZ1 0.077 phospholipase C, zeta 1 PLCG1 0.077 phospholipase C, gamma 1 isoform a PLCG1 0.077 phospholipase C, gamma 1 isoform b PLCG2 0.072 phospholipase C, gamma 2 WIPF1 0.012 WAS/WASL interacting protein family, member 1 [Homo... WIPF1 0.012 WAS/WASL interacting protein family, member 1 FLJ22184 0.011 PREDICTED: hypothetical protein FLJ22184 BSN 0.011 bassoon protein WNK2 0.010 WNK lysine deficient protein kinase 2 SF3A2 0.010 splicing factor 3a, subunit 2 SF1 0.010 splicing factor 1 isoform 1Human BLASTP results (used to prepare the table) | |||
Gene descriptions are from NCBI RefSeq. Search results were obtained with NCBI BLAST and RefSeq entries. When identical proteins are present, the self-match may not be listed first in BLASTP output. In such cases, the table above has been reordered to place it first.
See About the Figures for the scoring system used in the figure above right. The same scoring system was used in the table of BLASTP results.
Guide to the Human Genome
Copyright © 2010 by Stewart Scherer. All rights reserved.
