
| Name: PLCH1 | Sequence: fasta or formatted (1655aa) | NCBI GI: 57863298 | |
|
Description: phospholipase C eta 1 isoform b
|
Referenced in: Calmodulin and Calcium
| ||
Other entries for this name:
alt prot [1693aa] phospholipase C eta 1 isoform a alt prot [1002aa] phospholipase C eta 1 isoform c | |||
|
Composition:
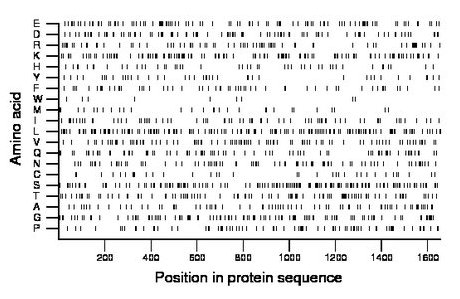
Amino acid Percentage Count Longest homopolymer A alanine 4.5 74 2 C cysteine 2.2 36 2 D aspartate 6.0 99 3 E glutamate 6.5 108 2 F phenylalanine 3.4 56 1 G glycine 6.3 105 3 H histidine 3.0 50 2 I isoleucine 4.5 74 2 K lysine 7.9 130 2 L leucine 9.4 155 4 M methionine 1.9 31 2 N asparagine 4.9 81 2 P proline 4.9 81 2 Q glutamine 5.0 82 3 R arginine 4.9 81 3 S serine 9.9 164 5 T threonine 6.0 99 2 V valine 5.9 98 2 W tryptophan 0.5 9 1 Y tyrosine 2.5 42 2 |
Comparative genomics:
Search single species RefSeq proteins at NCBI
Search summary 
Figure data | ||
Related human proteins:Protein Relative score Description Self-match 1.000 phospholipase C eta 1 isoform b PLCH1 0.996 phospholipase C eta 1 isoform a PLCH1 0.577 phospholipase C eta 1 isoform c PLCH2 0.359 phospholipase C, eta 2 PLCL2 0.095 phospholipase C-like 2 isoform 1 PLCL2 0.095 phospholipase C-like 2 isoform 2 PLCD4 0.094 phospholipase C, delta 4 PLCL1 0.094 phospholipase C-like 1 isoform a PLCL1 0.094 phospholipase C-like 1 isoform b PLCB4 0.092 phospholipase C beta 4 isoform a PLCB4 0.092 phospholipase C beta 4 isoform b PLCE1 0.085 phospholipase C, epsilon 1 PLCD3 0.082 phospholipase C delta 3 PLCD1 0.081 phospholipase C, delta 1 isoform 2 PLCD1 0.081 phospholipase C, delta 1 isoform 1 PLCB3 0.079 phospholipase C beta 3 PLCZ1 0.066 phospholipase C, zeta 1 PLCG1 0.064 phospholipase C, gamma 1 isoform a PLCG1 0.064 phospholipase C, gamma 1 isoform b PLCG2 0.063 phospholipase C, gamma 2 PLCB1 0.045 phosphoinositide-specific phospholipase C beta 1 iso... PLCB1 0.045 phosphoinositide-specific phospholipase C beta 1 iso... PLCB2 0.044 phospholipase C, beta 2 PLS3 0.006 plastin 3 PLS3 0.006 plastin 3 CABP5 0.006 calcium binding protein 5 CALML5 0.006 calmodulin-like 5 CALML3 0.006 calmodulin-like 3 CALM3 0.005 calmodulin 3 CALM2 0.005 calmodulin 2Human BLASTP results (used to prepare the table) | |||
Gene descriptions are from NCBI RefSeq. Search results were obtained with NCBI BLAST and RefSeq entries. When identical proteins are present, the self-match may not be listed first in BLASTP output. In such cases, the table above has been reordered to place it first.
See About the Figures for the scoring system used in the figure above right. The same scoring system was used in the table of BLASTP results.
Guide to the Human Genome
Copyright © 2010 by Stewart Scherer. All rights reserved.
