
| Name: PLCD1 | Sequence: fasta or formatted (777aa) | NCBI GI: 195972883 | |
|
Description: phospholipase C, delta 1 isoform 1
|
Referenced in: Inositol Pathways
| ||
Other entries for this name:
alt prot [756aa] phospholipase C, delta 1 isoform 2 | |||
|
Composition:
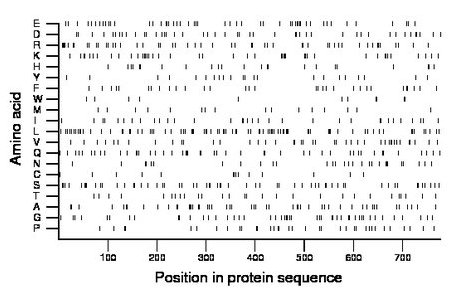
Amino acid Percentage Count Longest homopolymer A alanine 6.6 51 2 C cysteine 1.8 14 1 D aspartate 6.0 47 2 E glutamate 6.7 52 2 F phenylalanine 4.0 31 1 G glycine 6.4 50 2 H histidine 3.1 24 2 I isoleucine 4.4 34 2 K lysine 5.5 43 2 L leucine 10.6 82 2 M methionine 2.2 17 1 N asparagine 3.9 30 2 P proline 4.6 36 2 Q glutamine 6.0 47 2 R arginine 6.8 53 2 S serine 8.0 62 3 T threonine 3.6 28 1 V valine 5.5 43 3 W tryptophan 1.4 11 2 Y tyrosine 2.8 22 1 |
Comparative genomics:
Search single species RefSeq proteins at NCBI
Search summary 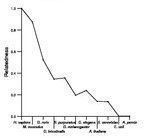
Figure data | ||
Related human proteins:Protein Relative score Description Self-match 1.000 phospholipase C, delta 1 isoform 1 PLCD1 0.961 phospholipase C, delta 1 isoform 2 PLCD3 0.474 phospholipase C delta 3 PLCD4 0.428 phospholipase C, delta 4 PLCL2 0.296 phospholipase C-like 2 isoform 1 PLCL2 0.296 phospholipase C-like 2 isoform 2 PLCL1 0.284 phospholipase C-like 1 isoform a PLCL1 0.284 phospholipase C-like 1 isoform b PLCZ1 0.280 phospholipase C, zeta 1 PLCB4 0.216 phospholipase C beta 4 isoform a PLCB4 0.216 phospholipase C beta 4 isoform b PLCB1 0.195 phosphoinositide-specific phospholipase C beta 1 iso... PLCB1 0.195 phosphoinositide-specific phospholipase C beta 1 iso... PLCB2 0.191 phospholipase C, beta 2 PLCH2 0.179 phospholipase C, eta 2 PLCH1 0.173 phospholipase C eta 1 isoform c PLCH1 0.173 phospholipase C eta 1 isoform a PLCH1 0.173 phospholipase C eta 1 isoform b PLCB3 0.172 phospholipase C beta 3 PLCG2 0.139 phospholipase C, gamma 2 PLCG1 0.128 phospholipase C, gamma 1 isoform a PLCG1 0.128 phospholipase C, gamma 1 isoform b PLCE1 0.125 phospholipase C, epsilon 1 SYT1 0.013 synaptotagmin I SYT1 0.013 synaptotagmin I SYT1 0.013 synaptotagmin I NEDD4L 0.012 neural precursor cell expressed, developmentally dow... NEDD4L 0.012 neural precursor cell expressed, developmentally do... NEDD4L 0.012 neural precursor cell expressed, developmentally do... NEDD4L 0.012 neural precursor cell expressed, developmentally do...Human BLASTP results (used to prepare the table) | |||
Gene descriptions are from NCBI RefSeq. Search results were obtained with NCBI BLAST and RefSeq entries. When identical proteins are present, the self-match may not be listed first in BLASTP output. In such cases, the table above has been reordered to place it first.
See About the Figures for the scoring system used in the figure above right. The same scoring system was used in the table of BLASTP results.
Guide to the Human Genome
Copyright © 2010 by Stewart Scherer. All rights reserved.
