
| Name: PLCL1 | Sequence: fasta or formatted (1095aa) | NCBI GI: 167900452 | |
|
Description: phospholipase C-like 1 isoform a
|
Referenced in:
| ||
Other entries for this name:
alt prot [997aa] phospholipase C-like 1 isoform b | |||
|
Composition:
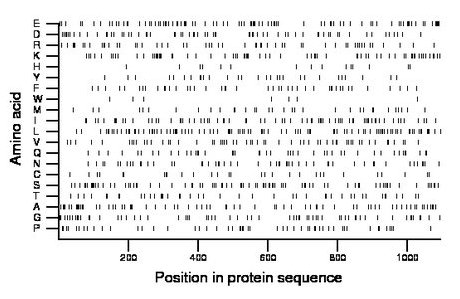
Amino acid Percentage Count Longest homopolymer A alanine 6.8 74 2 C cysteine 2.7 30 1 D aspartate 6.0 66 3 E glutamate 8.1 89 3 F phenylalanine 4.0 44 2 G glycine 6.0 66 3 H histidine 1.4 15 1 I isoleucine 6.6 72 2 K lysine 7.0 77 2 L leucine 8.9 98 2 M methionine 3.2 35 2 N asparagine 4.8 53 2 P proline 4.8 53 2 Q glutamine 4.2 46 2 R arginine 5.1 56 2 S serine 7.8 85 3 T threonine 4.0 44 2 V valine 5.1 56 2 W tryptophan 0.6 7 1 Y tyrosine 2.6 29 2 |
Comparative genomics:
Search single species RefSeq proteins at NCBI
Search summary 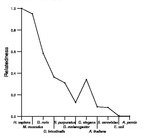
Figure data | ||
Related human proteins:Protein Relative score Description Self-match 1.000 phospholipase C-like 1 isoform a PLCL1 0.910 phospholipase C-like 1 isoform b PLCL2 0.638 phospholipase C-like 2 isoform 1 PLCL2 0.621 phospholipase C-like 2 isoform 2 PLCD4 0.210 phospholipase C, delta 4 PLCD1 0.203 phospholipase C, delta 1 isoform 2 PLCD1 0.203 phospholipase C, delta 1 isoform 1 PLCZ1 0.189 phospholipase C, zeta 1 PLCD3 0.183 phospholipase C delta 3 PLCH2 0.150 phospholipase C, eta 2 PLCH1 0.145 phospholipase C eta 1 isoform c PLCH1 0.145 phospholipase C eta 1 isoform a PLCH1 0.143 phospholipase C eta 1 isoform b PLCB1 0.141 phosphoinositide-specific phospholipase C beta 1 iso... PLCB1 0.141 phosphoinositide-specific phospholipase C beta 1 iso... PLCB4 0.140 phospholipase C beta 4 isoform a PLCB4 0.140 phospholipase C beta 4 isoform b PLCB2 0.117 phospholipase C, beta 2 PLCG2 0.080 phospholipase C, gamma 2 PLCG1 0.074 phospholipase C, gamma 1 isoform a PLCG1 0.074 phospholipase C, gamma 1 isoform b PLCB3 0.073 phospholipase C beta 3 PLCE1 0.063 phospholipase C, epsilon 1 CC2D1B 0.008 coiled-coil and C2 domain containing 1B PLA2G4A 0.008 cytosolic phospholipase A2, group IVA DOC2A 0.008 double C2-like domains, alpha RASA3 0.008 RAS p21 protein activator 3 SYT1 0.007 synaptotagmin I SYT1 0.007 synaptotagmin I SYT1 0.007 synaptotagmin IHuman BLASTP results (used to prepare the table) | |||
Gene descriptions are from NCBI RefSeq. Search results were obtained with NCBI BLAST and RefSeq entries. When identical proteins are present, the self-match may not be listed first in BLASTP output. In such cases, the table above has been reordered to place it first.
See About the Figures for the scoring system used in the figure above right. The same scoring system was used in the table of BLASTP results.
Guide to the Human Genome
Copyright © 2010 by Stewart Scherer. All rights reserved.
