
| Name: PDSS1 | Sequence: fasta or formatted (415aa) | NCBI GI: 50659086 | |
|
Description: prenyl diphosphate synthase, subunit 1
|
Referenced in:
| ||
|
Composition:
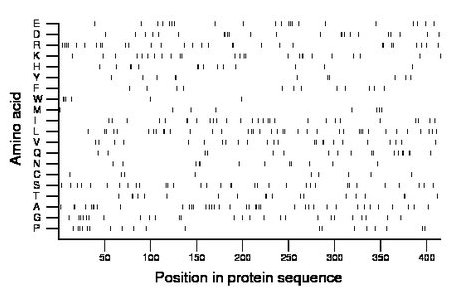
Amino acid Percentage Count Longest homopolymer A alanine 9.4 39 3 C cysteine 2.2 9 1 D aspartate 5.5 23 2 E glutamate 5.1 21 1 F phenylalanine 2.9 12 1 G glycine 6.3 26 1 H histidine 3.4 14 2 I isoleucine 6.7 28 2 K lysine 6.0 25 2 L leucine 9.2 38 2 M methionine 1.9 8 1 N asparagine 2.9 12 2 P proline 4.6 19 1 Q glutamine 4.3 18 2 R arginine 7.2 30 2 S serine 8.0 33 2 T threonine 4.6 19 2 V valine 5.8 24 2 W tryptophan 1.4 6 2 Y tyrosine 2.7 11 2 |
Comparative genomics:
Search single species RefSeq proteins at NCBI
Search summary 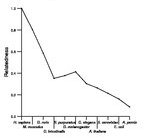
Figure data | ||
Related human proteins:Protein Relative score Description Self-match 1.000 prenyl diphosphate synthase, subunit 1 PDSS2 0.081 prenyl diphosphate synthase, subunit 2 GGPS1 0.030 geranylgeranyl diphosphate synthase 1 isoform A [Hom... GGPS1 0.030 geranylgeranyl diphosphate synthase 1 isoform A [Homo... GGPS1 0.025 geranylgeranyl diphosphate synthase 1 isoform B [Hom... FDPS 0.011 farnesyl diphosphate synthase isoform b FDPS 0.011 farnesyl diphosphate synthase isoform a FDPS 0.011 farnesyl diphosphate synthase isoform a SYT13 0.010 synaptotagmin XIII KHSRP 0.007 KH-type splicing regulatory protein EFNB3 0.007 ephrin-B3 precursor LOC100289224 0.006 PREDICTED: hypothetical protein XP_002344297 GPR150 0.006 G protein-coupled receptor 150 LOC653548 0.006 PREDICTED: double homeobox, 4-like DUX4 0.006 double homeobox, 4 LOC728410 0.006 double homeobox, 4-like LOC653543 0.006 double homeobox, 4-like LOC653545 0.006 double homeobox, 4-like LOC653544 0.006 double homeobox, 4-like PRR12 0.006 proline rich 12 LOC100293519 0.006 PREDICTED: hypothetical protein LOC100287870 0.006 PREDICTED: hypothetical protein XP_002343158 COL7A1 0.006 alpha 1 type VII collagen precursor FCN2 0.006 ficolin 2 isoform b precursor FCN2 0.006 ficolin 2 isoform a precursor ZFPM1 0.006 zinc finger protein, multitype 1 IFIH1 0.005 interferon induced with helicase C domain 1 LOC100292057 0.005 PREDICTED: hypothetical protein XP_002345830 LOC100293766 0.005 PREDICTED: hypothetical protein LOC100287121 0.005 PREDICTED: hypothetical proteinHuman BLASTP results (used to prepare the table) | |||
Gene descriptions are from NCBI RefSeq. Search results were obtained with NCBI BLAST and RefSeq entries. When identical proteins are present, the self-match may not be listed first in BLASTP output. In such cases, the table above has been reordered to place it first.
See About the Figures for the scoring system used in the figure above right. The same scoring system was used in the table of BLASTP results.
Guide to the Human Genome
Copyright © 2010 by Stewart Scherer. All rights reserved.
