
| Name: GPR150 | Sequence: fasta or formatted (434aa) | NCBI GI: 40385873 | |
|
Description: G protein-coupled receptor 150
|
Referenced in:
| ||
|
Composition:
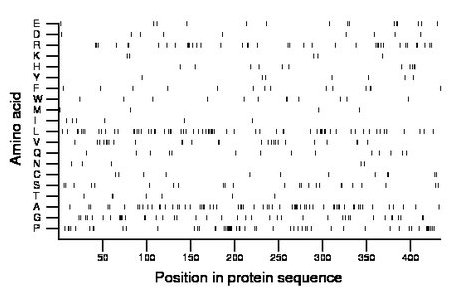
Amino acid Percentage Count Longest homopolymer A alanine 14.7 64 4 C cysteine 2.8 12 2 D aspartate 2.1 9 1 E glutamate 3.5 15 2 F phenylalanine 3.2 14 2 G glycine 9.4 41 4 H histidine 2.5 11 2 I isoleucine 1.4 6 1 K lysine 1.2 5 1 L leucine 15.2 66 3 M methionine 0.9 4 1 N asparagine 1.2 5 1 P proline 12.2 53 6 Q glutamine 3.2 14 1 R arginine 9.0 39 3 S serine 5.5 24 2 T threonine 1.6 7 2 V valine 6.0 26 2 W tryptophan 2.8 12 2 Y tyrosine 1.6 7 1 |
Comparative genomics:
Search single species RefSeq proteins at NCBI
Search summary 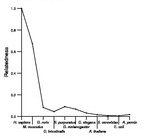
Figure data | ||
Related human proteins:Protein Relative score Description Self-match 1.000 G protein-coupled receptor 150 OXTR 0.086 oxytocin receptor AVPR2 0.082 arginine vasopressin receptor 2 isoform 1 AVPR1B 0.081 arginine vasopressin receptor 1B AVPR1A 0.074 arginine vasopressin receptor 1A NPSR1 0.067 G protein-coupled receptor for asthma susceptibility... NPSR1 0.065 G protein-coupled receptor for asthma susceptibility... AVPR2 0.064 arginine vasopressin receptor 2 isoform 2 SSTR5 0.050 somatostatin receptor 5 GALR2 0.046 galanin receptor 2 UTS2R 0.042 urotensin 2 receptor GALR3 0.033 galanin receptor 3 GNRHR 0.032 gonadotropin-releasing hormone receptor isoform 1 [Ho... NPBWR1 0.031 G protein-coupled receptor 7 MCHR1 0.030 G protein-coupled receptor 24 KISS1R 0.030 G protein-coupled receptor 54 SSTR4 0.027 somatostatin receptor 4 GPR61 0.025 G protein-coupled receptor 61 DRD5 0.024 dopamine receptor D5 S1PR4 0.023 sphingosine-1-phosphate receptor 4 precursor SSTR3 0.022 somatostatin receptor 3 P2RY11 0.021 purinergic receptor P2Y11 NTSR2 0.021 neurotensin receptor 2 PPAN-P2RY11 0.021 PPAN-P2RY11 protein SSTR2 0.021 somatostatin receptor 2 MLNR 0.021 motilin receptor TACR3 0.019 tachykinin receptor 3 LMTK3 0.019 lemur tyrosine kinase 3 ADRB1 0.019 beta-1-adrenergic receptor LTB4R2 0.019 leukotriene B4 receptor 2Human BLASTP results (used to prepare the table) | |||
Gene descriptions are from NCBI RefSeq. Search results were obtained with NCBI BLAST and RefSeq entries. When identical proteins are present, the self-match may not be listed first in BLASTP output. In such cases, the table above has been reordered to place it first.
See About the Figures for the scoring system used in the figure above right. The same scoring system was used in the table of BLASTP results.
Guide to the Human Genome
Copyright © 2010 by Stewart Scherer. All rights reserved.
