
| Name: SOAT1 | Sequence: fasta or formatted (550aa) | NCBI GI: 49533617 | |
|
Description: sterol O-acyltransferase 1
|
Referenced in: Bile Acids and Other Cholesterol Derivatives
| ||
|
Composition:
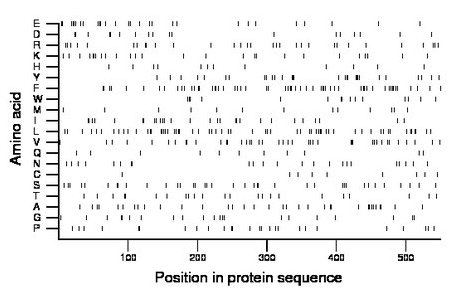
Amino acid Percentage Count Longest homopolymer A alanine 6.2 34 2 C cysteine 1.6 9 1 D aspartate 3.3 18 2 E glutamate 5.1 28 2 F phenylalanine 10.5 58 2 G glycine 3.8 21 2 H histidine 2.2 12 1 I isoleucine 5.3 29 3 K lysine 4.9 27 2 L leucine 11.1 61 2 M methionine 2.5 14 1 N asparagine 4.2 23 2 P proline 4.7 26 2 Q glutamine 2.0 11 1 R arginine 5.6 31 2 S serine 6.9 38 2 T threonine 4.2 23 2 V valine 7.8 43 3 W tryptophan 2.7 15 2 Y tyrosine 5.3 29 3 |
Comparative genomics:
Search single species RefSeq proteins at NCBI
Search summary 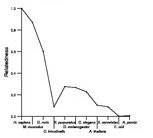
Figure data | ||
Related human proteins:Protein Relative score Description Self-match 1.000 sterol O-acyltransferase 1 SOAT2 0.432 acyl-CoA:cholesterol acyltransferase 2 DGAT1 0.088 diacylglycerol O-acyltransferase 1 KIF3C 0.008 kinesin family member 3C ACTN4 0.007 actinin, alpha 4 KIF17 0.007 kinesin family member 17 isoform b KIF17 0.007 kinesin family member 17 isoform a CETN2 0.007 caltractin DUOXA2 0.006 dual oxidase activator 2 KIF24 0.006 kinesin family member 24 KIF14 0.006 kinesin family member 14 ACTN1 0.006 actinin, alpha 1 isoform c ACTN1 0.006 actinin, alpha 1 isoform a ACTN1 0.006 actinin, alpha 1 isoform b TRAM1 0.006 translocation associated membrane protein 1 C3orf63 0.005 retinoblastoma-associated protein 140 isoform a [Ho... TRAM2 0.005 translocation-associated membrane protein 2 KIF3B 0.005 kinesin family member 3B CALD1 0.005 caldesmon 1 isoform 5 CALD1 0.005 caldesmon 1 isoform 2 PIGB 0.005 phosphatidylinositol glycan, class B SLC35B1 0.005 solute carrier family 35, member B1 CDCA7L 0.005 cell division cycle associated 7-like isoform 3 [Ho... CDCA7L 0.005 cell division cycle associated 7-like isoform 2 [Ho... CDCA7L 0.005 cell division cycle associated 7-like isoform 1 [Hom... GPX8 0.004 glutathione peroxidase 8 NOP14 0.004 probable nucleolar complex protein 14 TRPV3 0.004 transient receptor potential cation channel, subfami... SLC2A12 0.004 solute carrier family 2 (facilitated glucose transpo... GPS1 0.004 G protein pathway suppressor 1 isoform 2Human BLASTP results (used to prepare the table) | |||
Gene descriptions are from NCBI RefSeq. Search results were obtained with NCBI BLAST and RefSeq entries. When identical proteins are present, the self-match may not be listed first in BLASTP output. In such cases, the table above has been reordered to place it first.
See About the Figures for the scoring system used in the figure above right. The same scoring system was used in the table of BLASTP results.
Guide to the Human Genome
Copyright © 2010 by Stewart Scherer. All rights reserved.
