| Name: PROZ | Sequence: fasta or formatted (400aa) | NCBI GI: 4506121 | |
|
Description: protein Z, vitamin K-dependent plasma glycoprotein
|
Referenced in:
| ||
|
Composition:

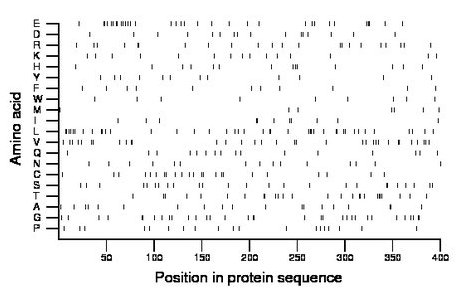
Amino acid Percentage Count Longest homopolymer A alanine 4.8 19 2 C cysteine 5.8 23 1 D aspartate 4.0 16 1 E glutamate 8.2 33 2 F phenylalanine 2.8 11 1 G glycine 8.2 33 2 H histidine 3.5 14 1 I isoleucine 2.8 11 2 K lysine 3.8 15 1 L leucine 10.2 41 2 M methionine 1.8 7 1 N asparagine 3.8 15 1 P proline 4.8 19 1 Q glutamine 4.0 16 1 R arginine 5.5 22 2 S serine 6.2 25 2 T threonine 6.5 26 2 V valine 8.2 33 2 W tryptophan 2.2 9 1 Y tyrosine 3.0 12 1 |
Comparative genomics:
Search single species RefSeq proteins at NCBI
Search summary 
Figure data | ||
Related human proteins:Protein Relative score Description Self-match 1.000 protein Z, vitamin K-dependent plasma glycoprotein [H... F10 0.201 coagulation factor X preproprotein F9 0.200 coagulation factor IX preproprotein PROC 0.185 protein C F7 0.183 coagulation factor VII isoform b precursor F7 0.178 coagulation factor VII isoform a precursor PROS1 0.112 protein S, alpha preproprotein GAS6 0.105 growth arrest-specific 6 isoform 1 precursor TMPRSS6 0.075 transmembrane protease, serine 6 SNED1 0.065 6720455I24Rik homolog CTRL 0.061 chymotrypsin-like PRRG3 0.057 proline rich Gla (G-carboxyglutamic acid) 3 (transme... PRRG1 0.056 proline rich Gla (G-carboxyglutamic acid) 1 PRRG1 0.056 proline rich Gla (G-carboxyglutamic acid) 1 FBLN7 0.055 fibulin 7 isoform 2 CTRB2 0.053 chymotrypsin B2 CTRB1 0.053 chymotrypsin B1 POL3S 0.053 polyserase 3 NOTCH3 0.052 Notch homolog 3 MEGF6 0.051 EGF-like-domain, multiple 3 F2 0.050 coagulation factor II preproprotein CRB1 0.050 crumbs homolog 1 precursor TMPRSS9 0.050 transmembrane protease, serine 9 KLKB1 0.048 plasma kallikrein B1 precursor CORIN 0.048 corin NOTCH1 0.048 notch1 preproprotein NOTCH2 0.047 notch 2 preproprotein CTRC 0.046 chymotrypsin C preproprotein UNQ9391 0.046 hypothetical protein LOC203074 SCUBE2 0.045 CEGP1 proteinHuman BLASTP results (used to prepare the table) | |||
Gene descriptions are from NCBI RefSeq. Search results were obtained with NCBI BLAST and RefSeq entries. When identical proteins are present, the self-match may not be listed first in BLASTP output. In such cases, the table above has been reordered to place it first.
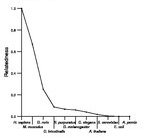
See About the Figures for the scoring system used in the figure above right. The same scoring system was used in the table of BLASTP results.
Guide to the Human Genome
Copyright © 2010 by Stewart Scherer. All rights reserved.
