
| Name: MDFIC | Sequence: fasta or formatted (355aa) | NCBI GI: 40018612 | |
|
Description: MyoD family inhibitor domain containing protein isoform p40
|
Referenced in: Helix-Loop-Helix Transcription Factors
| ||
|
Composition:
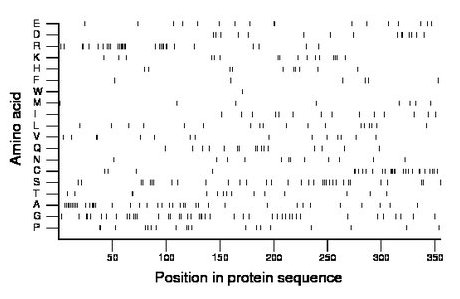
Amino acid Percentage Count Longest homopolymer A alanine 11.0 39 4 C cysteine 7.9 28 5 D aspartate 4.2 15 2 E glutamate 4.8 17 2 F phenylalanine 1.7 6 1 G glycine 12.1 43 3 H histidine 2.8 10 2 I isoleucine 3.9 14 1 K lysine 4.5 16 2 L leucine 5.1 18 1 M methionine 2.3 8 1 N asparagine 3.4 12 1 P proline 5.4 19 2 Q glutamine 4.5 16 1 R arginine 8.5 30 6 S serine 9.3 33 2 T threonine 4.2 15 2 V valine 4.2 15 2 W tryptophan 0.3 1 1 Y tyrosine 0.0 0 0 |
Comparative genomics:
Search single species RefSeq proteins at NCBI
Search summary 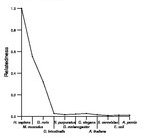
Figure data | ||
Related human proteins:Protein Relative score Description Self-match 1.000 MyoD family inhibitor domain containing protein isof... MDFI 0.203 MyoD family inhibitor LOC100128160 0.058 PREDICTED: similar to mCG127065 LOC100128160 0.058 PREDICTED: similar to mCG127065 LOC100128160 0.058 PREDICTED: similar to mCG127065 KRTAP5-2 0.031 keratin associated protein 5-2 SHANK3 0.029 SH3 and multiple ankyrin repeat domains 3 KRTAP5-8 0.028 keratin associated protein 5-8 KRTAP5-10 0.028 keratin associated protein 5-10 LOC100292370 0.026 PREDICTED: hypothetical protein LOC100287063 0.026 PREDICTED: hypothetical protein KRTAP10-6 0.026 keratin associated protein 10-6 KRTAP5-11 0.026 keratin associated protein 5-11 SOX11 0.025 SRY-box 11 FLJ37078 0.025 hypothetical protein LOC222183 KRTAP10-4 0.025 keratin associated protein 10-4 KRTAP5-5 0.025 keratin associated protein 5-5 KRTAP5-4 0.025 keratin associated protein 5-4 KRTAP5-6 0.024 keratin associated protein 5-6 LOC100291624 0.024 PREDICTED: hypothetical protein XP_002345876 LOC100289712 0.024 PREDICTED: hypothetical protein XP_002346761 LOC100287455 0.024 PREDICTED: hypothetical protein XP_002342583 KRTAP5-3 0.024 keratin associated protein 5-3 KRTAP10-7 0.024 keratin associated protein 10-7 KRTAP5-9 0.024 keratin associated protein 5-9 KRTAP5-7 0.022 keratin associated protein 5-7 LOC100290372 0.021 PREDICTED: hypothetical protein XP_002346788 LOC100288606 0.021 PREDICTED: hypothetical protein XP_002342652 LOC100293375 0.021 PREDICTED: hypothetical protein KRTAP5-1 0.021 keratin associated protein 5-1Human BLASTP results (used to prepare the table) | |||
Gene descriptions are from NCBI RefSeq. Search results were obtained with NCBI BLAST and RefSeq entries. When identical proteins are present, the self-match may not be listed first in BLASTP output. In such cases, the table above has been reordered to place it first.
See About the Figures for the scoring system used in the figure above right. The same scoring system was used in the table of BLASTP results.
Guide to the Human Genome
Copyright © 2010 by Stewart Scherer. All rights reserved.
