
| Name: ANK3 | Sequence: fasta or formatted (1001aa) | NCBI GI: 32967599 | |
|
Description: ankyrin 3 isoform 2
|
Referenced in:
| ||
Other entries for this name:
alt prot [4377aa] ankyrin 3 isoform 1 | |||
|
Composition:
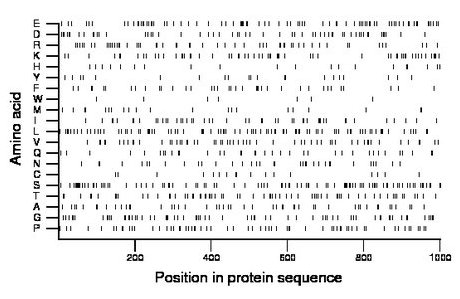
Amino acid Percentage Count Longest homopolymer A alanine 5.0 50 2 C cysteine 1.7 17 1 D aspartate 5.8 58 2 E glutamate 8.2 82 3 F phenylalanine 3.7 37 1 G glycine 6.6 66 2 H histidine 2.1 21 2 I isoleucine 5.0 50 3 K lysine 6.3 63 2 L leucine 8.9 89 2 M methionine 2.2 22 2 N asparagine 3.4 34 2 P proline 6.8 68 3 Q glutamine 3.7 37 2 R arginine 5.5 55 3 S serine 9.6 96 2 T threonine 6.9 69 2 V valine 5.9 59 2 W tryptophan 0.7 7 1 Y tyrosine 2.1 21 1 |
Comparative genomics:
Search single species RefSeq proteins at NCBI
Search summary 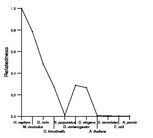
Figure data | ||
Related human proteins:Protein Relative score Description Self-match 1.000 ankyrin 3 isoform 2 ANK3 0.590 ankyrin 3 isoform 1 ANK2 0.469 ankyrin 2 isoform 2 ANK2 0.464 ankyrin 2 isoform 3 ANK2 0.415 ankyrin 2 isoform 1 ANK1 0.378 ankyrin 1 isoform 9 ANK1 0.378 ankyrin 1 isoform 1 ANK1 0.378 ankyrin 1 isoform 3 ANK1 0.378 ankyrin 1 isoform 4 ANK1 0.361 ankyrin 1 isoform 2 LRDD 0.033 leucine rich repeat and death domain containing prot... LRDD 0.032 leucine rich repeat and death domain containing prot... LRDD 0.031 leucine rich repeat and death domain containing prot... FLJ16686 0.018 hypothetical protein LOC401124 RIPK1 0.012 receptor (TNFRSF)-interacting serine-threonine kinas... KIAA2018 0.009 hypothetical protein LOC205717 UNC5CL 0.008 unc-5 homolog C-like FADD 0.006 Fas-associated via death domain NEFH 0.006 neurofilament, heavy polypeptide 200kDa MAPT 0.006 microtubule-associated protein tau isoform 2 DKC1 0.006 dyskerin isoform 1 PLEKHM2 0.006 pleckstrin homology domain containing, family M (wi... TNFRSF10A 0.006 tumor necrosis factor receptor superfamily, member 1... TRIM54 0.006 ring finger protein 30 isoform 1 TJP1 0.006 tight junction protein 1 isoform b TJP1 0.006 tight junction protein 1 isoform a NGFR 0.005 nerve growth factor receptor precursor KTN1 0.005 kinectin 1 isoform b BOD1L 0.005 biorientation of chromosomes in cell division 1-like... CMYA5 0.005 cardiomyopathy associated 5Human BLASTP results (used to prepare the table) | |||
Gene descriptions are from NCBI RefSeq. Search results were obtained with NCBI BLAST and RefSeq entries. When identical proteins are present, the self-match may not be listed first in BLASTP output. In such cases, the table above has been reordered to place it first.
See About the Figures for the scoring system used in the figure above right. The same scoring system was used in the table of BLASTP results.
Guide to the Human Genome
Copyright © 2010 by Stewart Scherer. All rights reserved.
