
| Name: EYA1 | Sequence: fasta or formatted (557aa) | NCBI GI: 26667219 | |
|
Description: eyes absent 1 isoform c
|
Referenced in: Additional Genes in Development
| ||
Other entries for this name:
alt prot [592aa] eyes absent 1 isoform b alt prot [592aa] eyes absent 1 isoform b alt prot [559aa] eyes absent 1 isoform a | |||
|
Composition:
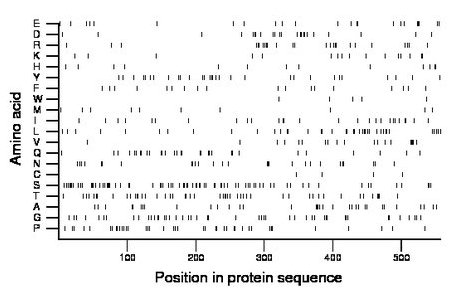
Amino acid Percentage Count Longest homopolymer A alanine 6.1 34 3 C cysteine 0.7 4 1 D aspartate 4.1 23 2 E glutamate 4.1 23 3 F phenylalanine 3.2 18 1 G glycine 8.4 47 2 H histidine 2.3 13 2 I isoleucine 4.8 27 2 K lysine 2.9 16 2 L leucine 7.0 39 2 M methionine 2.0 11 1 N asparagine 4.8 27 3 P proline 7.4 41 3 Q glutamine 5.6 31 2 R arginine 4.5 25 2 S serine 13.6 76 3 T threonine 8.6 48 3 V valine 3.4 19 2 W tryptophan 0.9 5 1 Y tyrosine 5.4 30 2 |
Comparative genomics:
Search single species RefSeq proteins at NCBI
Search summary 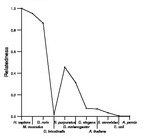
Figure data | ||
Related human proteins:Protein Relative score Description Self-match 1.000 eyes absent 1 isoform c EYA1 0.980 eyes absent 1 isoform b EYA1 0.980 eyes absent 1 isoform b EYA1 0.905 eyes absent 1 isoform a EYA4 0.674 eyes absent 4 isoform b EYA4 0.665 eyes absent 4 isoform a EYA4 0.651 eyes absent 4 isoform d EYA2 0.541 eyes absent 2 isoform a EYA2 0.541 eyes absent 2 isoform b EYA2 0.541 eyes absent 2 isoform a EYA2 0.541 eyes absent 2 isoform a EYA2 0.501 eyes absent 2 isoform c EYA3 0.405 eyes absent 3 EWSR1 0.028 Ewing sarcoma breakpoint region 1 isoform 5 EWSR1 0.028 Ewing sarcoma breakpoint region 1 isoform 3 EWSR1 0.028 Ewing sarcoma breakpoint region 1 isoform 2 EWSR1 0.026 Ewing sarcoma breakpoint region 1 isoform 4 POLR2A 0.025 DNA-directed RNA polymerase II A MUC21 0.024 mucin 21 NUP214 0.024 nucleoporin 214kDa EWSR1 0.024 Ewing sarcoma breakpoint region 1 isoform 1 FUS 0.023 fusion (involved in t(12;16) in malignant liposarcoma... MUC5AC 0.023 mucin 5AC MUC4 0.023 mucin 4 isoform a ATN1 0.023 atrophin-1 ATN1 0.023 atrophin-1 RBM14 0.023 RNA binding motif protein 14 MUC12 0.022 PREDICTED: mucin 12 MUC12 0.022 PREDICTED: mucin 12, cell surface associated MUC6 0.022 mucin 6, gastricHuman BLASTP results (used to prepare the table) | |||
Gene descriptions are from NCBI RefSeq. Search results were obtained with NCBI BLAST and RefSeq entries. When identical proteins are present, the self-match may not be listed first in BLASTP output. In such cases, the table above has been reordered to place it first.
See About the Figures for the scoring system used in the figure above right. The same scoring system was used in the table of BLASTP results.
Guide to the Human Genome
Copyright © 2010 by Stewart Scherer. All rights reserved.
