
| Name: FUS | Sequence: fasta or formatted (526aa) | NCBI GI: 4826734 | |
|
Description: fusion (involved in t(12;16) in malignant liposarcoma)
| Not currently referenced in the text | ||
|
Composition:
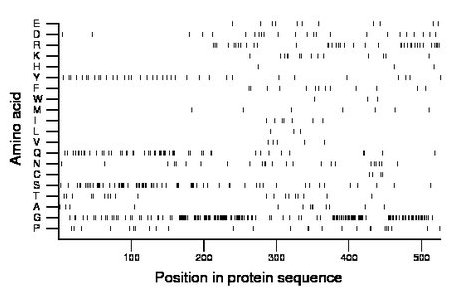
Amino acid Percentage Count Longest homopolymer A alanine 2.5 13 2 C cysteine 0.8 4 1 D aspartate 4.9 26 2 E glutamate 2.1 11 1 F phenylalanine 2.5 13 1 G glycine 28.9 152 10 H histidine 0.6 3 1 I isoleucine 1.5 8 2 K lysine 2.7 14 2 L leucine 0.6 3 1 M methionine 1.5 8 1 N asparagine 4.6 24 2 P proline 5.1 27 2 Q glutamine 9.9 52 3 R arginine 7.0 37 2 S serine 12.9 68 3 T threonine 3.6 19 1 V valine 1.0 5 1 W tryptophan 0.6 3 1 Y tyrosine 6.8 36 1 |
Comparative genomics:
Search single species RefSeq proteins at NCBI
Search summary 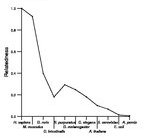
Figure data | ||
Related human proteins:Protein Relative score Description Self-match 1.000 fusion (involved in t(12;16) in malignant liposarcoma... EWSR1 0.398 Ewing sarcoma breakpoint region 1 isoform 4 EWSR1 0.393 Ewing sarcoma breakpoint region 1 isoform 3 EWSR1 0.393 Ewing sarcoma breakpoint region 1 isoform 1 EWSR1 0.392 Ewing sarcoma breakpoint region 1 isoform 2 TAF15 0.346 TBP-associated factor 15 isoform 1 TAF15 0.344 TBP-associated factor 15 isoform 2 EWSR1 0.115 Ewing sarcoma breakpoint region 1 isoform 5 FLG2 0.112 filaggrin family member 2 HRNR 0.103 hornerin KRT9 0.069 keratin 9 HNRNPA3 0.069 heterogeneous nuclear ribonucleoprotein A3 NCL 0.066 nucleolin KRT10 0.065 keratin 10 LOR 0.065 loricrin KRT1 0.063 keratin 1 ILF3 0.063 interleukin enhancer binding factor 3 isoform d [Ho... ILF3 0.063 interleukin enhancer binding factor 3 isoform a [Hom... HNRNPA0 0.063 heterogeneous nuclear ribonucleoprotein A0 DMKN 0.062 dermokine isoform 3 precursor HNRNPA1 0.061 heterogeneous nuclear ribonucleoprotein A1 isoform b... FAM98B 0.061 family with sequence similarity 98, member B isofor... DMKN 0.060 dermokine isoform 4 precursor DMKN 0.060 dermokine isoform 2 precursor ARID1B 0.060 AT rich interactive domain 1B (SWI1-like) isoform 2 ... ARID1B 0.060 AT rich interactive domain 1B (SWI1-like) isoform 1 ... ARID1B 0.060 AT rich interactive domain 1B (SWI1-like) isoform 3 ... DMKN 0.060 dermokine isoform 5 precursor HNRNPA2B1 0.059 heterogeneous nuclear ribonucleoprotein A2/B1 isofor... HNRNPA2B1 0.059 heterogeneous nuclear ribonucleoprotein A2/B1 isoform...Human BLASTP results (used to prepare the table) | |||
Gene descriptions are from NCBI RefSeq. Search results were obtained with NCBI BLAST and RefSeq entries. When identical proteins are present, the self-match may not be listed first in BLASTP output. In such cases, the table above has been reordered to place it first.
See About the Figures for the scoring system used in the figure above right. The same scoring system was used in the table of BLASTP results.
Guide to the Human Genome
Copyright © 2010 by Stewart Scherer. All rights reserved.
