
| Name: LOC100293319 | Sequence: fasta or formatted (263aa) | NCBI GI: 239753274 | |
|
Description: PREDICTED: hypothetical protein
| Not currently referenced in the text | ||
|
Composition:
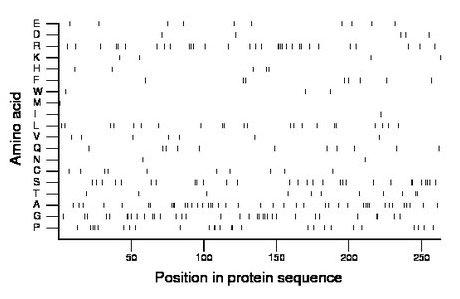
Amino acid Percentage Count Longest homopolymer A alanine 16.0 42 3 C cysteine 3.8 10 1 D aspartate 1.9 5 1 E glutamate 3.8 10 1 F phenylalanine 3.0 8 1 G glycine 12.9 34 2 H histidine 1.9 5 1 I isoleucine 0.4 1 1 K lysine 1.5 4 1 L leucine 8.4 22 2 M methionine 0.4 1 1 N asparagine 0.8 2 1 P proline 9.9 26 2 Q glutamine 4.2 11 1 R arginine 12.2 32 4 S serine 11.0 29 2 T threonine 4.2 11 2 V valine 2.7 7 1 W tryptophan 1.1 3 1 Y tyrosine 0.0 0 0 |
Comparative genomics:
Search single species RefSeq proteins at NCBI
Search summary 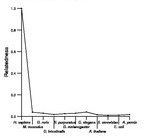
Figure data | ||
Related human proteins:Protein Relative score Description Self-match 1.000 PREDICTED: hypothetical protein LOC100291551 0.994 PREDICTED: hypothetical protein XP_002346445 COL3A1 0.041 collagen type III alpha 1 preproprotein KLF16 0.035 BTE-binding protein 4 COL1A2 0.035 alpha 2 type I collagen LOC100132848 0.033 PREDICTED: hypothetical protein LOC348751 0.031 PREDICTED: hypothetical protein LOC348751 0.031 PREDICTED: hypothetical protein isoform 4 LOC348751 0.031 PREDICTED: hypothetical protein isoform 2 LOC728046 0.029 PREDICTED: hypothetical protein FOXD1 0.027 forkhead box D1 LOC728650 0.027 PREDICTED: hypothetical protein LOC100132891 0.027 PREDICTED: hypothetical protein LOC100132891 0.027 PREDICTED: hypothetical protein LOC100132891 0.027 PREDICTED: hypothetical protein CXorf67 0.027 hypothetical protein LOC340602 LOC100287063 0.025 PREDICTED: hypothetical protein SCAF1 0.025 SR-related CTD-associated factor 1 LOC100293975 0.023 PREDICTED: hypothetical protein LOC100292591 0.023 PREDICTED: hypothetical protein LOC100292150 0.023 PREDICTED: hypothetical protein LOC100290812 0.023 PREDICTED: hypothetical protein XP_002347678 LOC100290302 0.023 PREDICTED: hypothetical protein XP_002346480 LOC100288205 0.023 PREDICTED: hypothetical protein XP_002343496 LOC100287337 0.023 PREDICTED: hypothetical protein XP_002342320 LOC100292122 0.023 PREDICTED: hypothetical protein XP_002345138 LOC100286986 0.023 PREDICTED: hypothetical protein XP_002344191 DACT3 0.023 thymus expressed gene 3-like SP8 0.023 Sp8 transcription factor isoform 1 SP8 0.023 Sp8 transcription factor isoform 2Human BLASTP results (used to prepare the table) | |||
Gene descriptions are from NCBI RefSeq. Search results were obtained with NCBI BLAST and RefSeq entries. When identical proteins are present, the self-match may not be listed first in BLASTP output. In such cases, the table above has been reordered to place it first.
See About the Figures for the scoring system used in the figure above right. The same scoring system was used in the table of BLASTP results.
Guide to the Human Genome
Copyright © 2010 by Stewart Scherer. All rights reserved.
