
| Name: RSL1D1 | Sequence: fasta or formatted (490aa) | NCBI GI: 118498359 | |
|
Description: ribosomal L1 domain containing 1
|
Referenced in:
| ||
|
Composition:
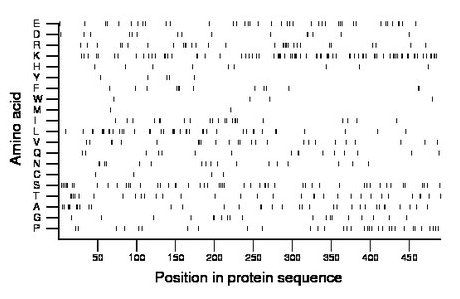
Amino acid Percentage Count Longest homopolymer A alanine 6.9 34 3 C cysteine 0.8 4 1 D aspartate 3.1 15 2 E glutamate 8.2 40 2 F phenylalanine 2.7 13 2 G glycine 3.9 19 2 H histidine 1.8 9 1 I isoleucine 4.5 22 2 K lysine 15.9 78 4 L leucine 8.2 40 3 M methionine 0.6 3 1 N asparagine 3.5 17 2 P proline 6.7 33 1 Q glutamine 3.3 16 2 R arginine 6.1 30 2 S serine 10.4 51 2 T threonine 6.5 32 2 V valine 5.1 25 2 W tryptophan 0.8 4 1 Y tyrosine 1.0 5 1 |
Comparative genomics:
Search single species RefSeq proteins at NCBI
Search summary 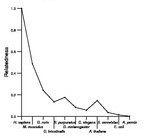
Figure data | ||
Related human proteins:Protein Relative score Description Self-match 1.000 ribosomal L1 domain containing 1 NEFH 0.046 neurofilament, heavy polypeptide 200kDa NEFM 0.037 neurofilament, medium polypeptide 150kDa isoform 1 ... NEFM 0.037 neurofilament, medium polypeptide 150kDa isoform 2 ... FAM133A 0.036 hypothetical protein LOC286499 PRG4 0.035 proteoglycan 4 isoform D PRG4 0.035 proteoglycan 4 isoform C PRG4 0.035 proteoglycan 4 isoform B PRG4 0.035 proteoglycan 4 isoform A MAP1B 0.035 microtubule-associated protein 1B LOC100133599 0.032 PREDICTED: hypothetical protein TRDN 0.031 triadin CYLC2 0.030 cylicin 2 AP3D1 0.029 adaptor-related protein complex 3, delta 1 subunit ... TTN 0.029 titin isoform N2-A RPL10A 0.029 ribosomal protein L10a PPP1R10 0.028 protein phosphatase 1, regulatory subunit 10 SFRS12 0.028 splicing factor, arginine/serine-rich 12 isoform a ... SFRS12 0.028 splicing factor, arginine/serine-rich 12 isoform b [... LOC100133599 0.027 PREDICTED: hypothetical protein SFRS11 0.027 splicing factor, arginine/serine-rich 11 USP8 0.027 ubiquitin specific peptidase 8 USP8 0.027 ubiquitin specific peptidase 8 USP8 0.027 ubiquitin specific peptidase 8 DDX21 0.027 DEAD (Asp-Glu-Ala-Asp) box polypeptide 21 SRRM2 0.027 splicing coactivator subunit SRm300 SRRM1 0.027 serine/arginine repetitive matrix 1 PRPF4B 0.027 serine/threonine-protein kinase PRP4K FAM133B 0.027 hypothetical protein LOC257415 isoform 2 FAM133B 0.027 hypothetical protein LOC257415 isoform 1Human BLASTP results (used to prepare the table) | |||
Gene descriptions are from NCBI RefSeq. Search results were obtained with NCBI BLAST and RefSeq entries. When identical proteins are present, the self-match may not be listed first in BLASTP output. In such cases, the table above has been reordered to place it first.
See About the Figures for the scoring system used in the figure above right. The same scoring system was used in the table of BLASTP results.
Guide to the Human Genome
Copyright © 2010 by Stewart Scherer. All rights reserved.
