
| Name: LOC100288303 | Sequence: fasta or formatted (213aa) | NCBI GI: 239746597 | |
|
Description: PREDICTED: hypothetical protein XP_002343794
| Not currently referenced in the text | ||
|
Composition:
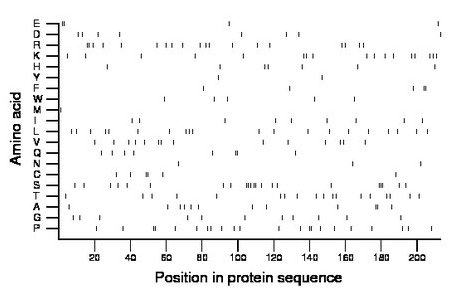
Amino acid Percentage Count Longest homopolymer A alanine 5.6 12 2 C cysteine 2.8 6 2 D aspartate 3.8 8 1 E glutamate 1.9 4 2 F phenylalanine 2.3 5 2 G glycine 5.2 11 1 H histidine 3.3 7 1 I isoleucine 4.2 9 1 K lysine 8.0 17 2 L leucine 9.4 20 1 M methionine 0.5 1 1 N asparagine 1.4 3 1 P proline 10.3 22 2 Q glutamine 3.8 8 2 R arginine 8.9 19 2 S serine 10.3 22 3 T threonine 8.5 18 1 V valine 6.6 14 2 W tryptophan 2.3 5 1 Y tyrosine 0.9 2 1 |
Comparative genomics:
Search single species RefSeq proteins at NCBI
Search summary 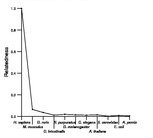
Figure data | ||
Related human proteins:Protein Relative score Description Self-match 1.000 PREDICTED: hypothetical protein XP_002343794 ATN1 0.024 atrophin-1 ATN1 0.024 atrophin-1 MAP4 0.022 microtubule-associated protein 4 isoform 5 MAP4 0.022 microtubule-associated protein 4 isoform 4 MAP4 0.022 microtubule-associated protein 4 isoform 2 MAP4 0.022 microtubule-associated protein 4 isoform 1 LOC100293347 0.019 PREDICTED: hypothetical protein isoform 1 LOC100288552 0.019 PREDICTED: hypothetical protein isoform 1 LOC100288552 0.019 PREDICTED: hypothetical protein XP_002343707 isofor... SDC3 0.014 syndecan 3 FRMD4A 0.014 FERM domain containing 4A LOC100293286 0.014 PREDICTED: hypothetical protein LOC100290832 0.014 PREDICTED: hypothetical protein XP_002347902 LOC100289128 0.014 PREDICTED: hypothetical protein XP_002343651 PAQR6 0.012 progestin and adipoQ receptor family member VI isofo... LOC147645 0.012 PREDICTED: hypothetical protein LOC147645 0.012 PREDICTED: hypothetical protein LOC147645 0.012 PREDICTED: hypothetical protein AFF1 0.012 myeloid/lymphoid or mixed-lineage leukemia trithorax ... LOC100133142 0.010 PREDICTED: similar to zinc finger protein 208 [Homo... LOC100133142 0.010 PREDICTED: similar to zinc finger protein 208 [Homo... TDRD6 0.010 tudor domain containing 6 LOC100291299 0.007 PREDICTED: hypothetical protein XP_002347506 LOC100287558 0.007 PREDICTED: hypothetical protein XP_002343325 MMP25 0.007 matrix metalloproteinase 25 preproprotein PKP3 0.007 plakophilin 3 MUC16 0.007 mucin 16 LOC100132234 0.007 PREDICTED: hypothetical protein LOC100132234 FAM83D 0.007 hypothetical protein LOC81610Human BLASTP results (used to prepare the table) | |||
Gene descriptions are from NCBI RefSeq. Search results were obtained with NCBI BLAST and RefSeq entries. When identical proteins are present, the self-match may not be listed first in BLASTP output. In such cases, the table above has been reordered to place it first.
See About the Figures for the scoring system used in the figure above right. The same scoring system was used in the table of BLASTP results.
Guide to the Human Genome
Copyright © 2010 by Stewart Scherer. All rights reserved.
